
Migrating Existing Dashboards to Databricks AI/BI, Part 2: Filter Actions, Cross-Filtering, and Drill-Through
How to connect visuals, enable cross-filtering, and drill into details in Databricks AI/BI Dashboards

As a Specialist Solutions Architect at Databricks, I often hear the same questions from customers who are migrating dashboards from legacy BI tools to Databricks AI/BI Dashboards:
“What’s the Databricks equivalent of the context filters we use today?”
“Can we still do cascading filters where each dropdown only shows relevant values?”
“Do you support filter actions when I click on a bar or a point?”
“How do we do user-based filtering in AI/BI Dashboards?”
In the first blog post in this series, I focused on the first two questions and showed how to recreate:
context filters using parameters in dataset SQL, and
“Only Relevant Values” filters using field filters and query-based parameters.
This blog tackles the third question: “How do we replace filter actions from existing dashboards when we click on a bar/segment/point?”
In many BI tools, this behavior is configured as a filter action (a click on a mark filters other views). In Databricks AI/BI Dashboards, the equivalent interactivity is split into two built-in features:
Cross-filtering, where clicking a mark in one chart filters other charts on the same page that use the same dataset.
Drill-through, where right-clicking a mark opens a target page filtered to that selection.
Once you combine cross-filtering and drill-through with the context and cascading patterns, you can reproduce most real-world filter-action workflows.
As before, I’ll use the built-in samples.tpch dataset. I’ve also published the companion dashboard, so you can follow along and inspect the configurations yourself.
Recap: TPCH Sales dataset
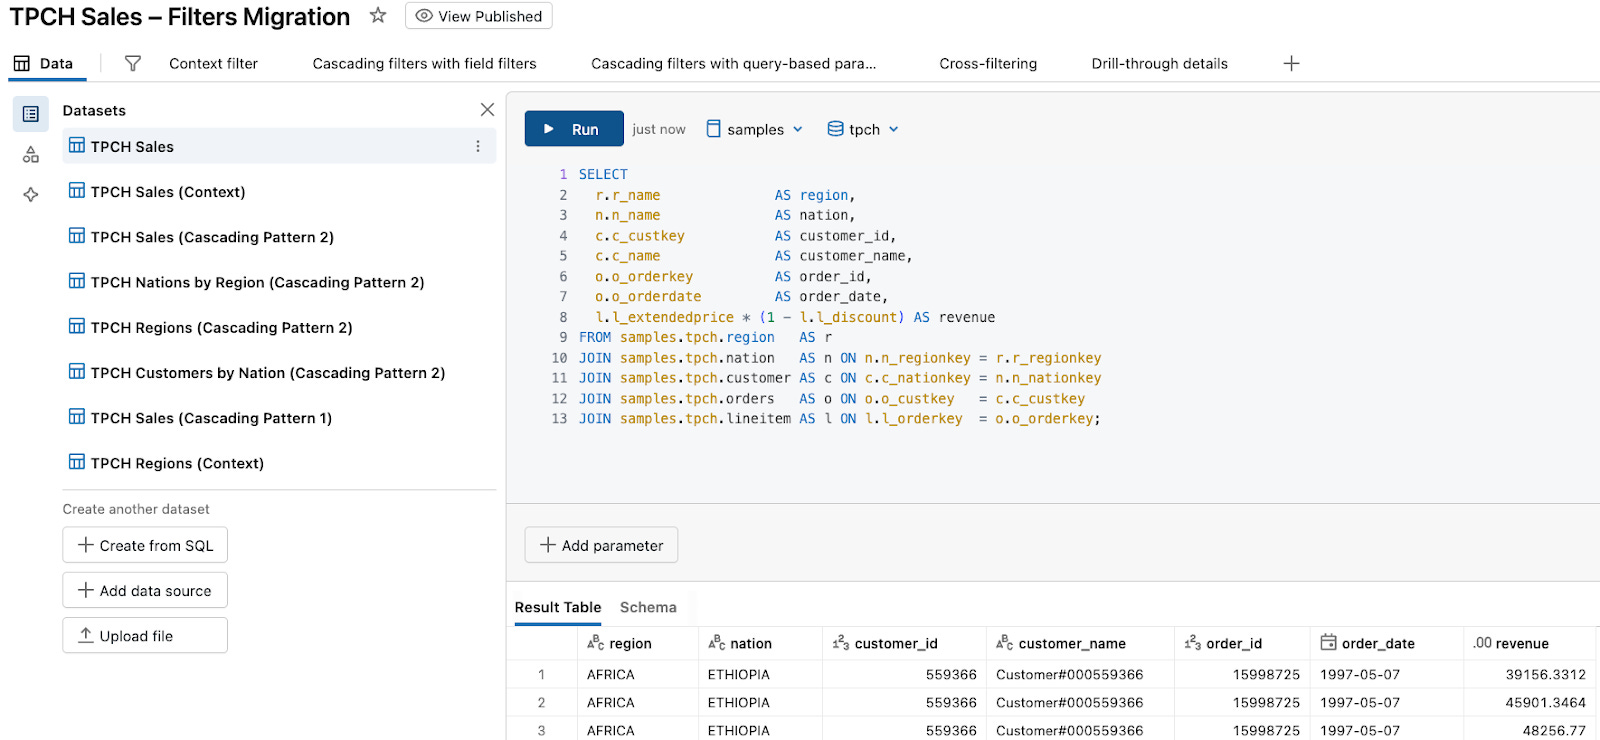
To keep examples concrete, we’ll use the TPCH sample data that ships with Databricks in the samples.tpch schema. I’ll reuse the same base dataset, TPCH Sales, from the first blog post, which joins tables region, nation, customer, orders, and lineitem, and computes revenue:
SELECT
  r.r_name              AS region,
  n.n_name              AS nation,
  c.c_custkey           AS customer_id,
  c.c_name              AS customer_name,
  o.o_orderkey          AS order_id,
  o.o_orderdate         AS order_date,
  l.l_extendedprice * (1 - l.l_discount) AS revenue
FROM samples.tpch.region   AS r
JOIN samples.tpch.nation   AS n ON n.n_regionkey = r.r_regionkey
JOIN samples.tpch.customer AS c ON c.c_nationkey = n.n_nationkey
JOIN samples.tpch.orders   AS o ON o.o_custkey   = c.c_custkey
JOIN samples.tpch.lineitem AS l ON l.l_orderkey  = o.o_orderkey;
In the companion dashboard, this is the TPCH Sales dataset. It and its derivatives are used by multiple pages:
Context filter
Cascading filters with field filters
Cascading filters with query-based parameters
Cross-filtering (new in this post)
Drill-through details (new in this post)
and others
Filter actions vs. cross-filtering and drill-through
Before we build anything, it helps to align vocabulary.
In many traditional BI tools, filter actions are configured explicitly:
You specify one or more source sheets.
You specify one or more target sheets.
You choose which fields are passed as filters.
You choose what happens when the selection is cleared.
In Databricks AI/BI Dashboards, cross-filtering is implicit. You don’t turn it on in the visualization panel.
It is automatically applied to supported visualization types that use the same dataset.
When you click a bar, slice, or point, AI/BI adds a filter based on that value and re-runs all other visualizations on the page that share the dataset.
In Databricks AI/BI Dashboards, drill-through is also implicit, but slightly more structured:
When you right-click a supported chart type, AI/BI shows Drill to → <target page> if there is another page in the dashboard that uses the same dataset.
The target page opens with all visuals based on that dataset filtered to the selected segment, and any compatible filters on that dataset are auto-populated.
Conceptually:
Cross-filtering ≈ a within-page filter action.
Drill-through ≈ a navigation filter action (summary → details).
The rest of the post walks through how to configure your pages so these implicit behaviors “just work”.
1. Recreating within-page filter actions with cross-filtering
A very common dashboard pattern is:
A summary bar chart (for example, total revenue by nation).
One or more supporting charts (for example, revenue share by region, or a donut chart for mix).
A filter action so clicking a bar filters the other visuals.
In AI/BI Dashboards, this becomes cross-filtering on top of the TPCH Sales dataset.
1.1. When cross-filtering is applied
Cross-filtering is applied automatically when all of the following are true:
The visualizations are on the same page.
The visualizations use the same dataset (for example, TPCH Sales).
The visualization type is one of the supported chart types: Bar, Box plot, Heatmap, Histogram, Pie, Scatter, or Point map.
If those conditions are met, there is nothing to enable. Clicks on supported charts become filters for any other visualizations on the page that use that dataset.
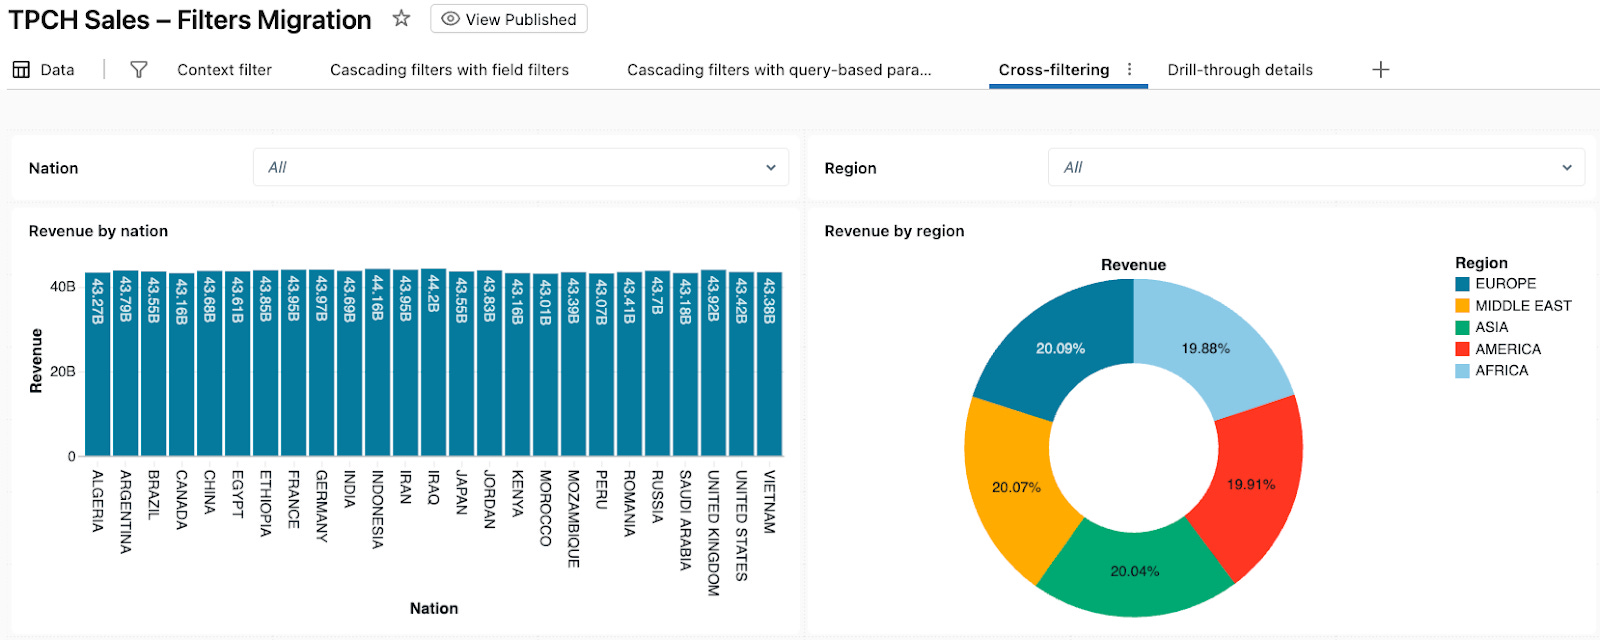
1.2. Build the Cross-filtering page
In your AI/BI dashboard, add a page named Cross-filtering.
On this page:
Add a bar chart: Revenue by nation
Visualization: Bar
Dataset = TPCH Sales
X axis:
nationY axis:
SUM(revenue)
Add a pie: Revenue by region
Visualization: Pie
Dataset = TPCH Sales
Slice by (Color):
regionValue (Angle):
SUM(revenue)
Add filters (optional)
Add a Region filter on
TPCH Sales.regionAdd a Nation filter on
TPCH Sales.nation
These are just standard filter widgets. There is no “cross-filtering” toggle anywhere in the configuration.
In the companion dashboard, this page is already built for you.
1.3. Use cross-filtering on the charts
Try the following workflow:
Select two regions, AFRICA and ASIA, on the Revenue by region chart.
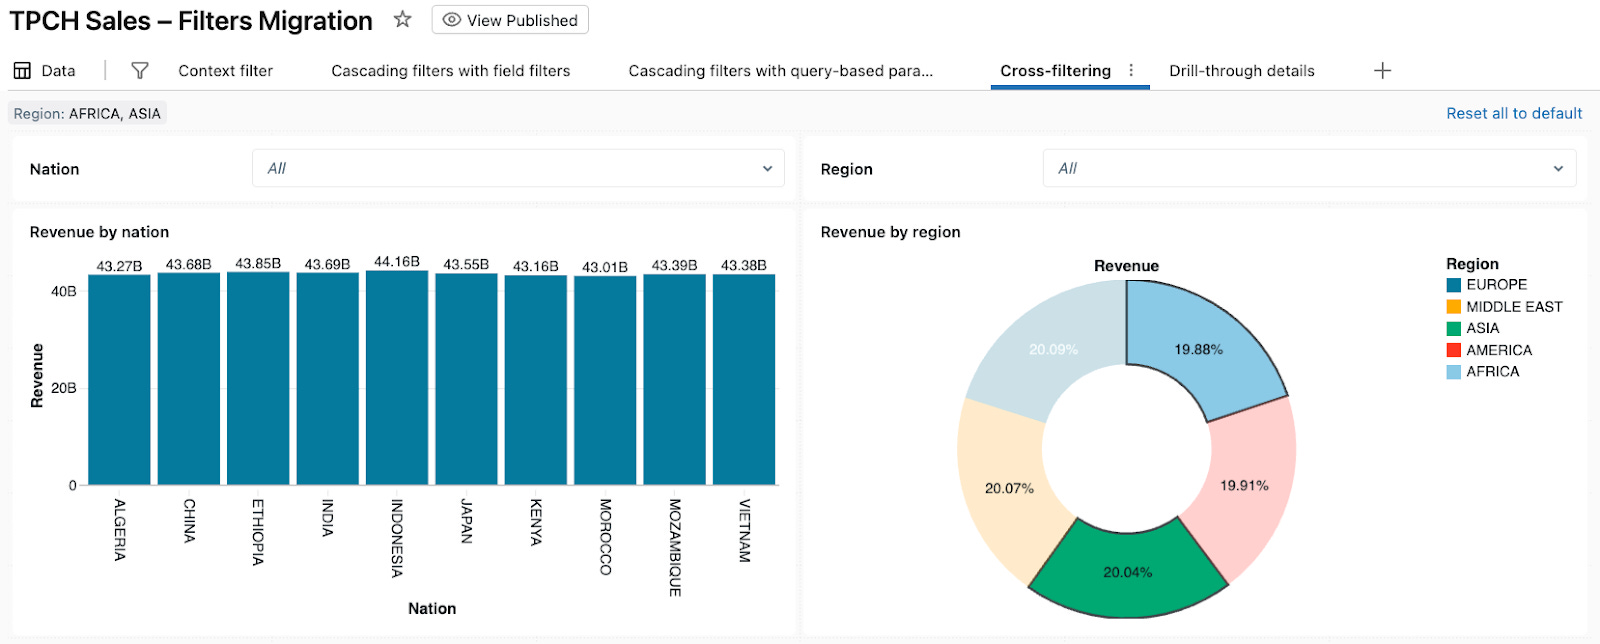
Click the bar for JAPAN in the Revenue by nation chart.
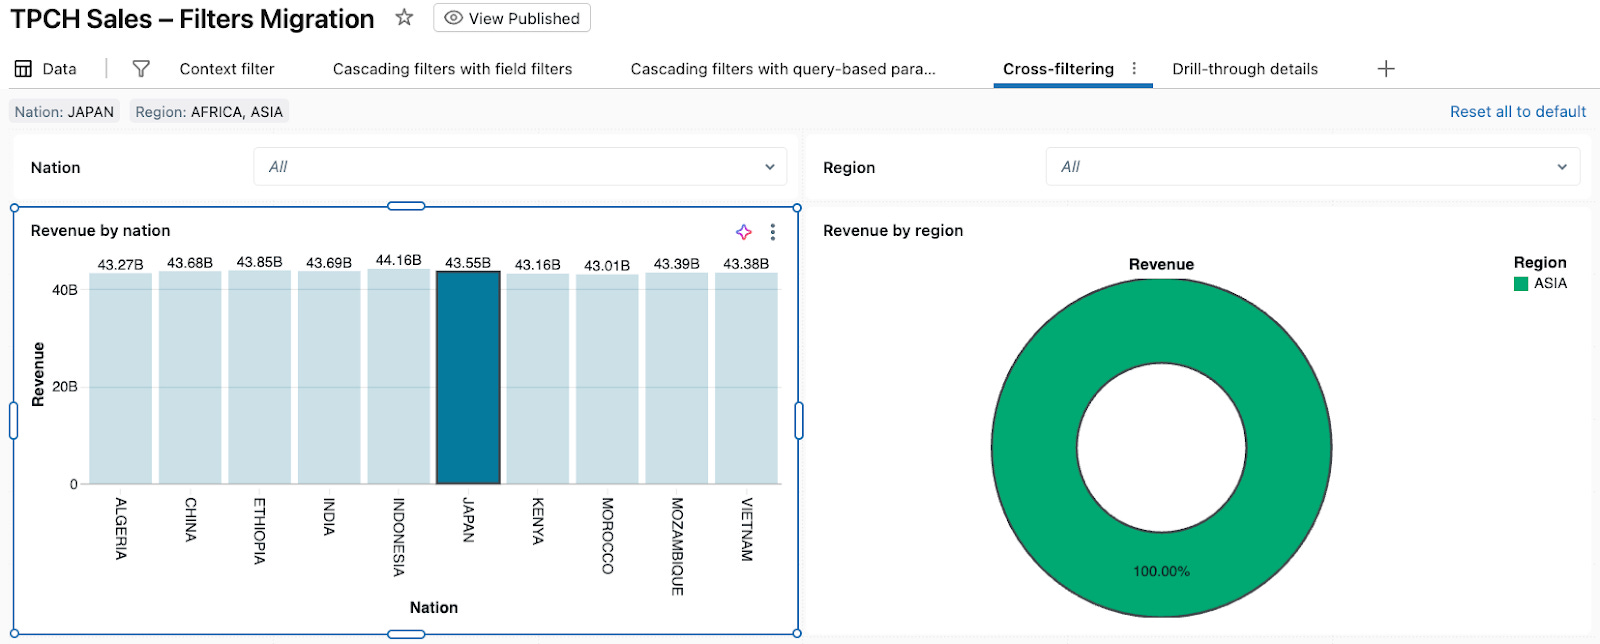
Because cross-filtering is automatic for supported charts that share a dataset:
AI/BI adds filters Nation: JAPAN and Region: AFRICA, ASIA to the TPCH Sales dataset for this page.
Both charts get updated accordingly.
You can Reset all to default and try a different filter combination.
From a migration perspective, this answers a common question: “Can clicking a bar automatically update the rest of the dashboard in AI/BI?” Yes – when charts share a dataset and use supported visualization types, cross-filtering works implicitly with no additional configuration.
2. Recreating across-page filter actions with drill-through
Another classic summary → detail filter-action pattern is:
A summary view (for example, revenue by nation).
A detail view (for example, individual orders).
A filter action that passes the selected value into the detail sheet as a filter.
In AI/BI Dashboards, this is implemented as drill-through.
2.1. How drill-through is applied
Drill-through shows up as a right-click option when several conditions are satisfied.
The source chart is a supported type: Bar, Box plot, Heatmap, Histogram, Pie, Scatter, or Point map.
There is at least one target page in the same dashboard where:
At least one visualization uses the same dataset as the source chart.
The field you click on has a compatible filter or column on the target page.
In recent AI/BI releases, drill-through no longer requires an explicit target filter; any visualization based on the same dataset as the source selection is filtered automatically, and filters (if they exist) are populated with the drilled values.
There is no drill-through toggle in the widget side panel. Once the above conditions are true, AI/BI surfaces Drill to → <page name> in the context menu automatically.
2.2. Build the Drill-through details page
In the same dashboard, add another page named Drill-through details.
On this page:
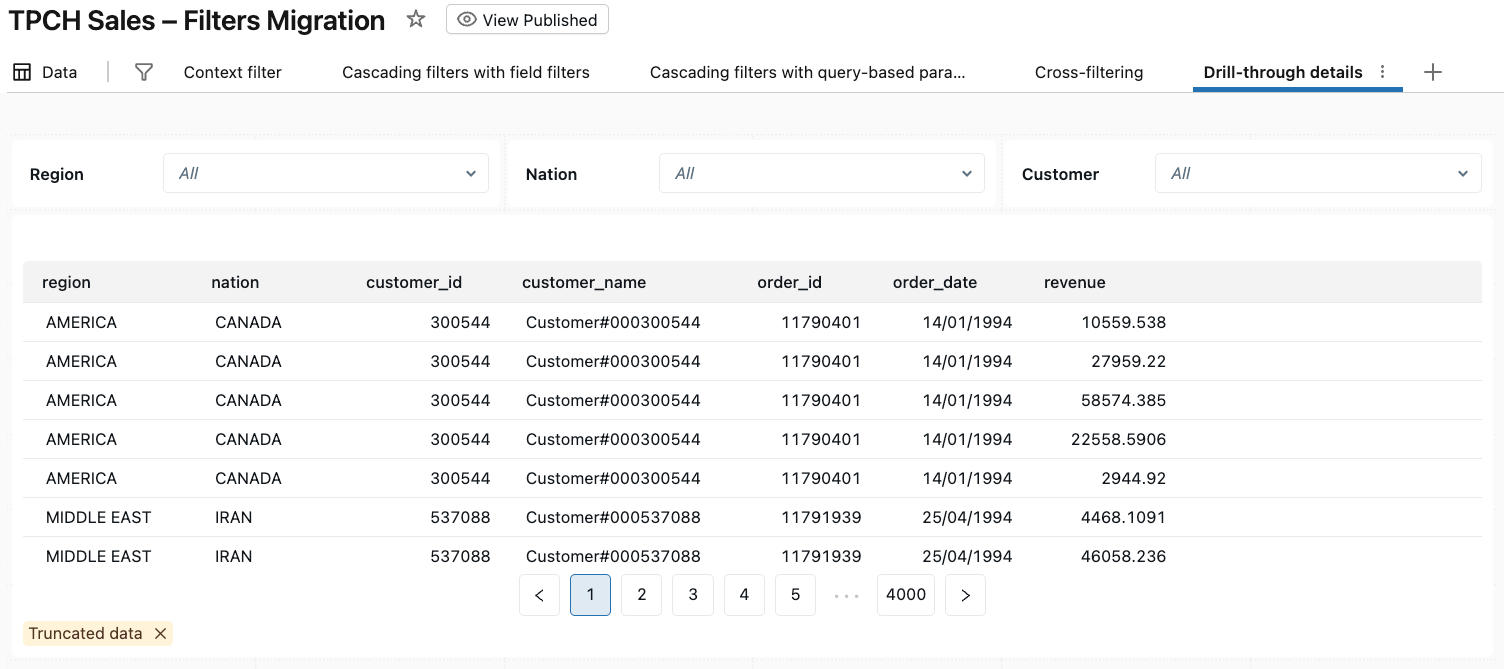
Add a detail table visualization
Visualization: Table
Dataset = TPCH Sales
Columns: region, nation, customer_id, customer_name, order_id, order_date, revenue
Add filters (optional)
Add a Region filter on
TPCH Sales.regionAdd a Nation filter on
TPCH Sales.nationAdd a Customer filter on
TPCH Sales.customer_id
Again, there is no special drill-through configuration here – just a normal page that uses the same dataset.
In the companion dashboard, this page is already built for you.
2.3. Drill from summary to details
Go back to the Cross-filtering page and right-click a bar in the Revenue by nation chart (for example, UNITED STATES).
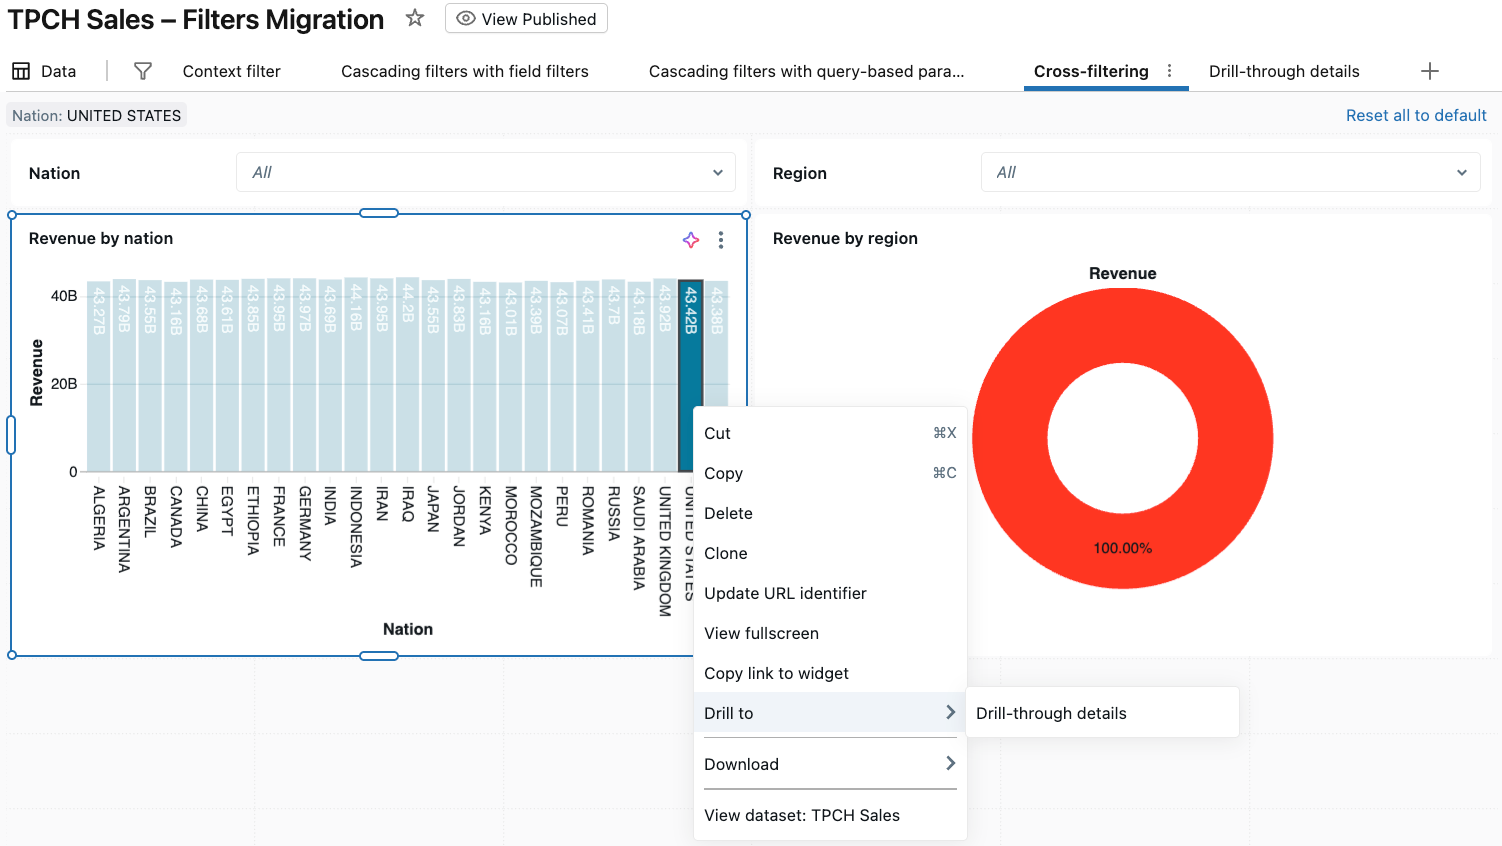
After clicking Drill to → Drill-through details, AI/BI opens the Drill-through details page and filters all visualizations based on TPCH Sales to Nation: UNITED STATES.
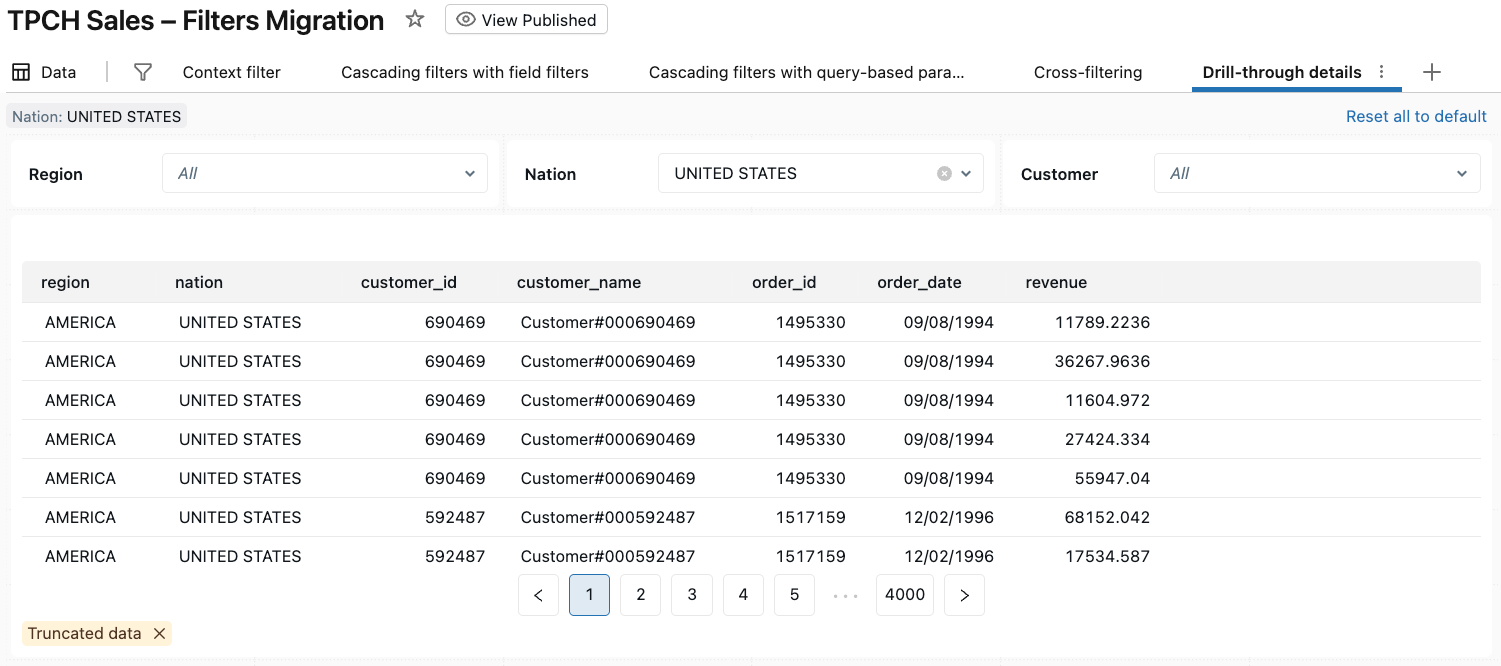
From the user’s perspective, this feels almost identical to a filter action in traditional dashboards that navigates from a summary sheet to a detailed sheet with the selected country carried over.
Cross-filtering vs. drill-through vs. filter widgets
Across this blog and the first blog, you now have three main interaction tools in AI/BI Dashboards:
Filter widgets
Context filters, cascading filters, and query-based parameters.
Best for primary, always-visible controls like Region, Date, Product.
Cross-filtering
Click data points in a supported visualization to filter other charts on the page that use the same dataset.
Best for ad-hoc exploration, answering questions like “What happens if I focus only on this region?” and “Which nations are driving that spike?”.
Drill-through
Right-click a mark to open another page already filtered to that selection.
Best for guided summary-to-detail flows where you don’t want to cram everything onto one page.
A simple migration rule of thumb:
Use filter widgets to rebuild the core filter panels from your existing dashboards.
Use cross-filtering to automatically filter other visualizations on the page based on chart interactions.
Use drill-through to replace “go to sheet” filter actions and connect high-level KPIs to detail pages.
Summary and what’s next
In this second blog post in the series, we answered: “Do you support filter actions when I click on a bar or a point?”
The short answer is yes:
Cross-filtering lets viewers click on supported charts to filter all other visualizations on the same page that share a dataset – no configuration required.
Drill-through lets viewers right-click a mark and open another page where visuals on the same dataset are already filtered to the selected values, and any matching filters are pre-populated.
Combined with the patterns from the first blog post – context filters and cascading “Only Relevant Values” filters – you now have a robust toolkit for recreating the interactive filtering experience your users expect from traditional dashboards inside Databricks AI/BI Dashboards.
The companion dashboard now includes: a context filter page, a field-based cascading page, a query-based cascading page, a cross-filtering page, and a drill-through details page. You can import it into your workspace and adapt the patterns to your own datasets.
In the next post in this series, I’ll tackle the remaining migration question: “How do we do user-based filtering and row-level security in AI/BI Dashboards?”