
Migrating Existing Dashboards to Databricks AI/BI, Part 1: Context and Cascading Filters
How to implement context filters and “only relevant values” behavior in Databricks AI/BI Dashboards

As a Specialist Solutions Architect at Databricks, I regularly work with customers who are migrating critical analytics from existing BI tools to Databricks AI/BI Dashboards – and the first questions I usually get are about filters.
Teams want to know:
“What’s the Databricks equivalent of the context filters we use today?”
“Can we still do cascading filters where each dropdown only shows relevant values?”
“Do you support filter actions when I click on a bar or a point?”
“How do we do user-based filtering in AI/BI Dashboards?”
These aren’t cosmetic features. They’re how analysts actually interact with dashboards, and they’re often the reason an existing BI dashboard feels “alive” instead of static.
In this post, I’ll walk through how to implement two familiar filter patterns from existing BI dashboards in Databricks AI/BI Dashboards, using the built-in samples.tpch dataset:
Context filters → implemented as parameters in dataset SQL
“Only Relevant Values” or cascading filters → implemented with field filters and query-based parameters
Row-level security and user-based filtering deserve their own deep dive, and action-style interactions (cross-filtering and drill-through) could easily fill another post, so I’ll cover those separately.
I’ve also published the companion dashboard, so you can follow along and inspect the configurations yourself.
Quick primer: datasets and filters in Databricks AI/BI Dashboards
Before we map those patterns, it helps to align on a few AI/BI Dashboards concepts:
Datasets
In AI/BI Dashboards, each dashboard has a Data tab where you define one or more datasets:
A dataset is defined by an SQL query, direct reference to a Unity Catalog table/view, or an uploaded file.
Multiple visualizations can reuse the same dataset.
Datasets are bundled with the dashboard when you share/export/import it.
Practically, a dataset is your “model” for a set of visuals: one query, many charts.
Field filters vs parameter filters
AI/BI Dashboards support two core ways to filter data from a dashboard: field filters and parameter filters. Both are implemented as filter widgets, but they behave differently under the hood.
Field filters are applied directly to dataset fields (columns) on top of the dataset query. Processing behaviour is defined by the dataset performance thresholds. Specifically, for small datasets (≤ 100K rows or ≤ 100MB), results are pulled to the browser and visualization-specific filtering and aggregation are applied client-side. For larger datasets, Databricks wraps the dataset query in a WITH clause and applies the filter predicates and aggregations in Databricks SQL warehouse (DBSQL).
Parameter filters are applied to parameters, which are variables that get substituted into your dataset SQL at runtime. When the parameter value changes, the query is always re-run in DBSQL.
In other words, field filters operate on the results of the dataset query, while parameter filters operate inside the dataset SQL itself.
To speed up processing, various caching layers in AI/BI Dashboards and DBSQL are used.
We’ll use parameter filters to emulate context filters, and field filters + query-based parameters to emulate “Only Relevant Values.”
Filter scope: global, page-level, and widget-level
Filters in AI/BI Dashboards also differ by scope:
Global filters are interactive filters in the global filters panel that apply across all pages of the dashboard to any visualization that shares the selected datasets.
Page-level filters are interactive filter widgets placed on a specific page in the canvas. They apply to all visualizations on that page that share one or more datasets.
Widget-level filters are static filters configured directly on a single visualization widget in its configuration panel. Authors set the values, and viewers can’t change them.
With that foundation in place, we can now map these context filters and “Only Relevant Values” patterns into AI/BI Dashboards patterns.
Sample dataset: TPCH on Databricks
To keep examples concrete, we’ll use the TPCH sample data that ships with Databricks in the samples.tpch schema.
For the purposes of this post, you can start by creating a dataset that joins tables region, nation, customer, orders, and lineitem:
SELECT
  r.r_name              AS region,
  n.n_name              AS nation,
  c.c_custkey           AS customer_id,
  c.c_name              AS customer_name,
  o.o_orderkey          AS order_id,
  o.o_orderdate         AS order_date,
  l.l_extendedprice * (1 - l.l_discount) AS revenue
FROM samples.tpch.region   AS r
JOIN samples.tpch.nation   AS n ON n.n_regionkey = r.r_regionkey
JOIN samples.tpch.customer AS c ON c.c_nationkey = n.n_nationkey
JOIN samples.tpch.orders   AS o ON o.o_custkey   = c.c_custkey
JOIN samples.tpch.lineitem AS l ON l.l_orderkey  = o.o_orderkey;
In AI/BI Dashboards, you define this query as a dataset in the Data tab and then reuse it across multiple visualizations. Let’s call this dataset TPCH Sales.
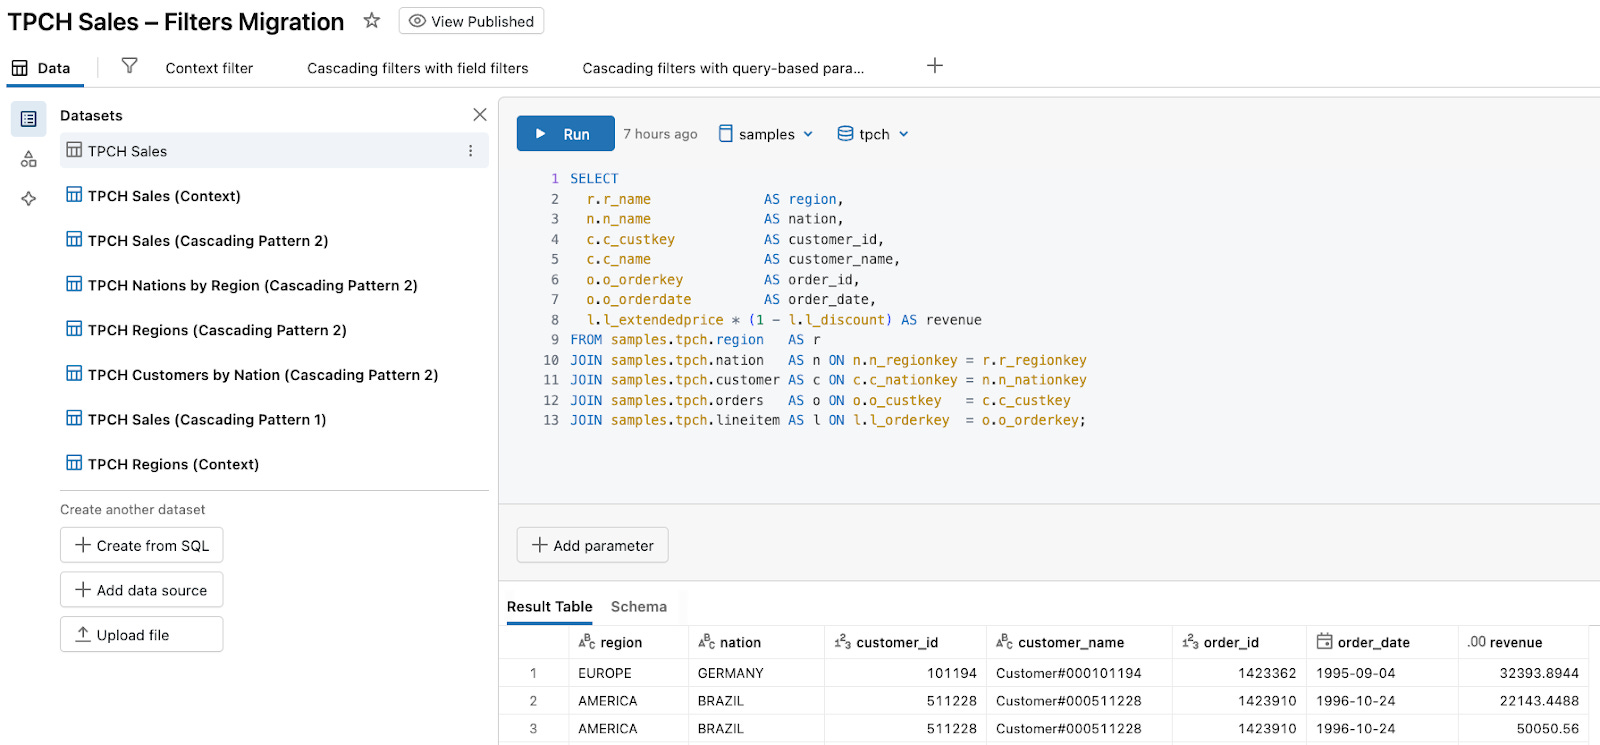
We’ll reuse this same dataset or its derivatives throughout the rest of the post to illustrate context filters and cascading filters.
Implementing context filters with parameters in dataset SQL
What a context filter does
A context filter defines a high-level subset of the data:
The context filter is applied first, often materializing a temporary subset.
Other filters and some calculations are then evaluated on top of that subset.
Context filters are used to:
Improve performance by filtering early and shrinking the working set.
Enforce logical order, such as “always filter by Region first.”
Make other filters depend on that subset.
How to think about context in AI/BI Dashboards
Given the primer:
Field filters operate on the results of the dataset query (Databricks wraps your dataset SQL and applies them on top).
Parameter filters substitute values directly into your dataset SQL, so they filter inside the query, before joins and aggregations.
If you want “context” behavior – filter first, then apply everything else – you should implement that filter as a parameter in the dataset SQL, driven by a parameter filter widget.
Pattern: treat the context as a base parameter
Let’s add a context filter for Region:
If you’re following along with the companion dashboard, this setup lives on the “Context filter” page.
Step 1. Define TPCH Sales (Context) with a Region parameter
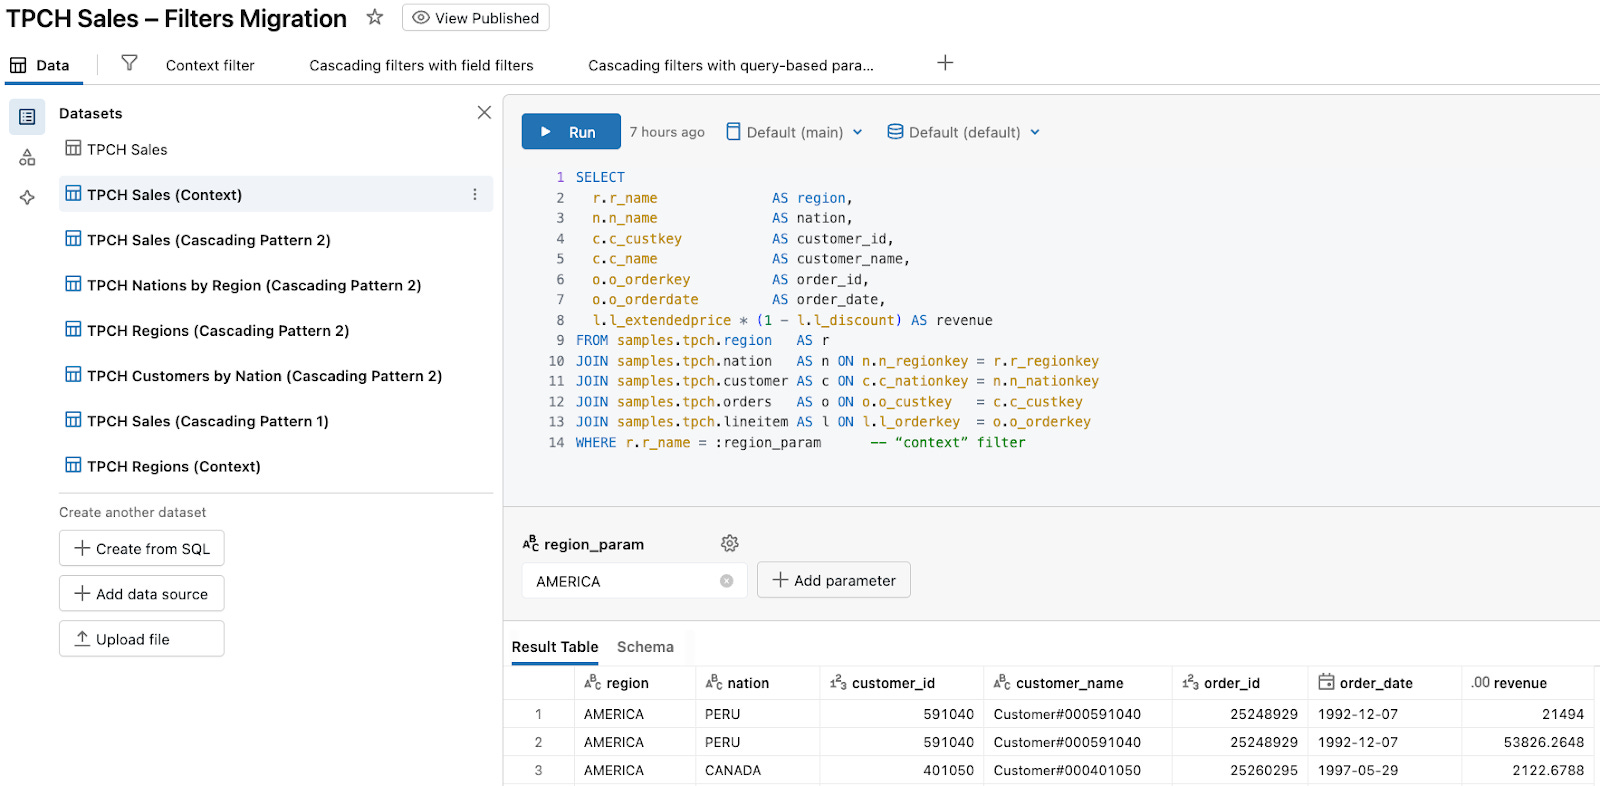
Create a dataset TPCH Sales (Context):
SELECT
  r.r_name              AS region,
  n.n_name              AS nation,
  c.c_custkey           AS customer_id,
  c.c_name              AS customer_name,
  o.o_orderkey          AS order_id,
  o.o_orderdate         AS order_date,
  l.l_extendedprice * (1 - l.l_discount) AS revenue
FROM samples.tpch.region   AS r
JOIN samples.tpch.nation   AS n ON n.n_regionkey = r.r_regionkey
JOIN samples.tpch.customer AS c ON c.c_nationkey = n.n_nationkey
JOIN samples.tpch.orders   AS o ON o.o_custkey   = c.c_custkey
JOIN samples.tpch.lineitem AS l ON l.l_orderkey  = o.o_orderkey
WHERE r.r_name = :region_param      -- “context” filter
In the dataset’s Parameters panel:
Define
region_paramwith type String.Optionally set a default (for example, AMERICA) so the dataset runs without any dashboard filter.
This makes region_param the context for all visuals that use TPCH Sales (Context).
Step 2. (Optional but nice) Create a helper dataset for Region values
You can drive region_param directly from TPCH Sales (Context), but a tiny helper dataset keeps things tidy, convenient, and re-usable.
Create TPCH Regions (Context):
SELECT DISTINCT r_name AS region
FROM samples.tpch.region
ORDER BY region;
This dataset has no parameters; it just returns the list of available regions.
Step 3. Add a Region parameter filter widget
We will configure the widget as a page-level filter (alternatively, you can move it into the global filters panel if it should apply across pages).
On the page where you want Region as a context filter:
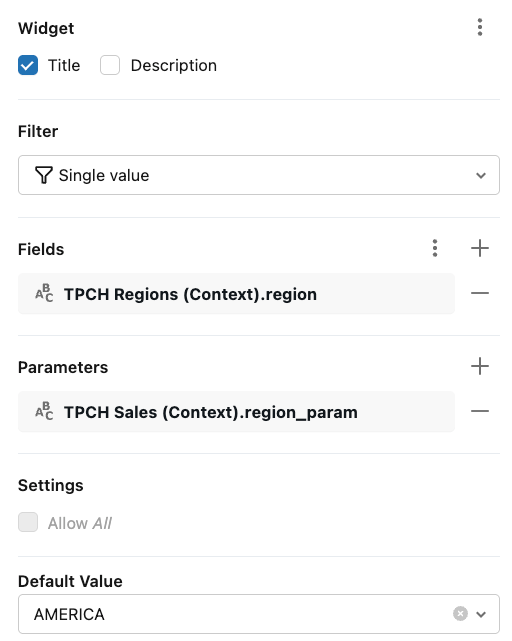
Add a filter widget and title it Region.
Set the filter type to Single value.
Configure it as a parameter filter:
Fields:
TPCH Regions (Context).regionParameters:
TPCH Sales (Context).region_param
If you don’t want a helper dataset, you can instead use TPCH Sales (Context).region as the field source, but the wiring is otherwise identical.
Effect
When a viewer selects Region: EUROPE in the Region filter:
The widget writes “EUROPE“ into
region_paramfor TPCH Sales (Context).TPCH Sales (Context) reruns with
WHERE r.r_name = ‘EUROPE’.
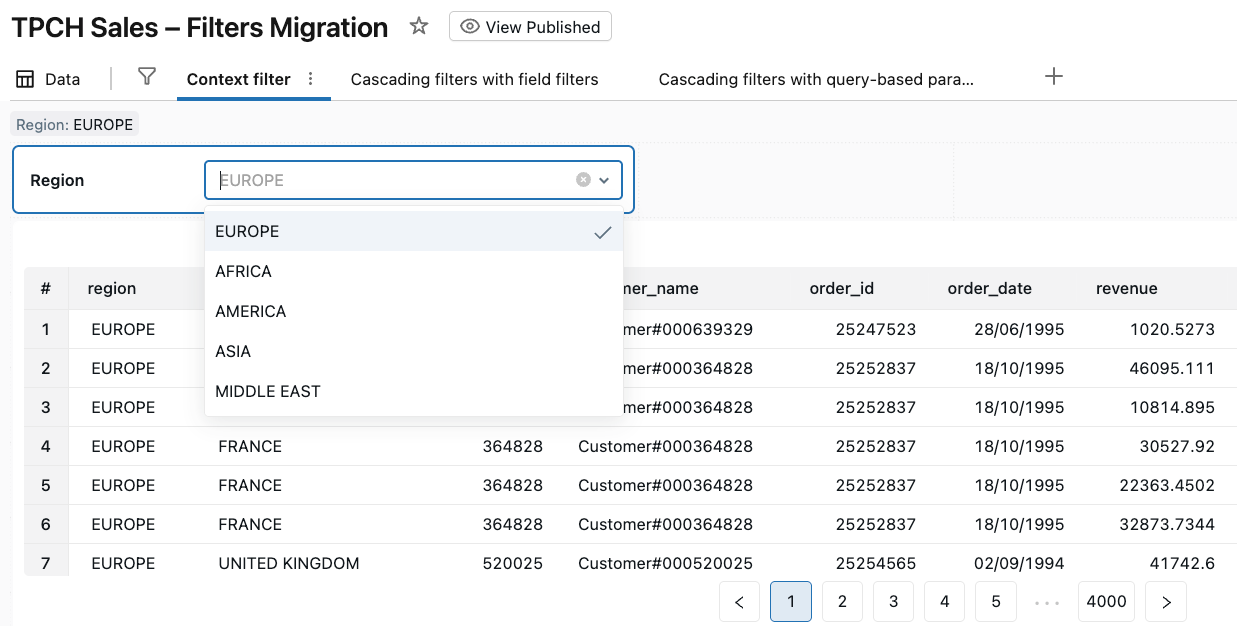
All visuals built on TPCH Sales (Context) now use only European data as their starting point.
Any additional field filters (for example, Nation, Customer, Date) operate on this already-filtered subset, just like secondary filters evaluated after a context filter.
From the viewer’s perspective, Region behaves like a true context filter: it defines the base subset of data first, and everything else – other filters, cross-filtering, drill-through – is evaluated on top of that context.
Implementing “Only Relevant Values” with cascading filters and query-based parameters
What “Only Relevant Values” behavior means
“Only Relevant Values” behavior on a filter shrinks the list of values based on the current state of other filters and the view:
If you select Region: ASIA, the Country filter only shows countries that actually have data in ASIA.
As you add more filters, each filter’s domain is recomputed from the filtered dataset.
Practically, this gives you cascading filters that stay in sync with each other and with the current slice of data.
How to think about “Only Relevant Values” in AI/BI Dashboards
In AI/BI Dashboards, you get the same effect in two ways:
Field filters on the same dataset – AI/BI recomputes the value list based on the current filtered dataset.
Query-based parameters – a specialized filter widget that both populates its values from a query, and writes the selected value into a parameter used in your dataset SQL.
Pattern 1: Cascading filters with field filters
The simplest way to mimic “Only Relevant Values” is to use field filters wired to the same dataset. AI/BI Dashboards will automatically recompute each filter’s value list based on the current filtered dataset.
We’ll build a Region → Nation → Customer cascade on top of TPCH Sales (Cascading Pattern 1).
In the companion dashboard, this pattern is implemented on the “Cascading filters with field filters” page.
Step 1. Define TPCH Sales (Cascading Pattern 1)
Create a dataset TPCH Sales (Cascading Pattern 1) with the base TPCH join and a revenue metric:
SELECT
  r.r_name              AS region,
  n.n_name              AS nation,
  c.c_custkey           AS customer_id,
  c.c_name              AS customer_name,
  o.o_orderkey          AS order_id,
  o.o_orderdate         AS order_date,
  l.l_extendedprice * (1 - l.l_discount) AS revenue
FROM samples.tpch.region   AS r
JOIN samples.tpch.nation   AS n ON n.n_regionkey = r.r_regionkey
JOIN samples.tpch.customer AS c ON c.c_nationkey = n.n_nationkey
JOIN samples.tpch.orders   AS o ON o.o_custkey   = c.c_custkey
JOIN samples.tpch.lineitem AS l ON l.l_orderkey  = o.o_orderkey;
This dataset has no parameters; all filtering will be done with field filters on top of the query results.
Step 2. Add Region, Nation, and Customer field filters
On the dashboard page where you want cascading behavior:
Add three field filter widgets with titles Region, Nation, and Customer.
Configure each widget as a page-level filter (or move them into the global filters panel if you want them to apply across pages).
Connect the filters to the following fields from TPCH Sales (Cascading Pattern 1):
Region →
regionNation →
nationCustomer →
customer_id
No parameters are involved here – these are pure field filters on a single dataset.
Effect
When a viewer selects region: ASIA, the TPCH Sales (Cascading Pattern 1) dataset is filtered to ASIA for all visuals on the page.
The Nation field filter’s value list is recomputed from that filtered dataset, so it only shows nations in ASIA.
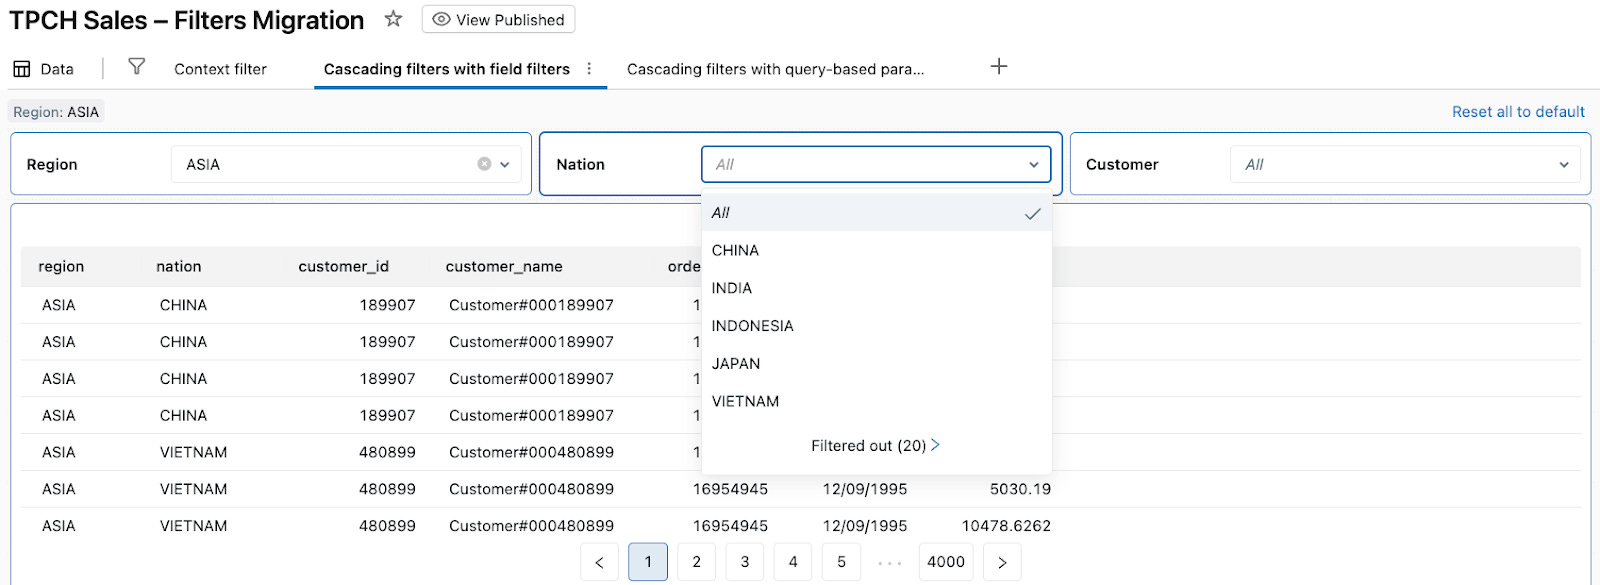
After the viewer chooses a nation (e.g., JAPAN), the Customer field filter shrinks to show only customers in that nation.
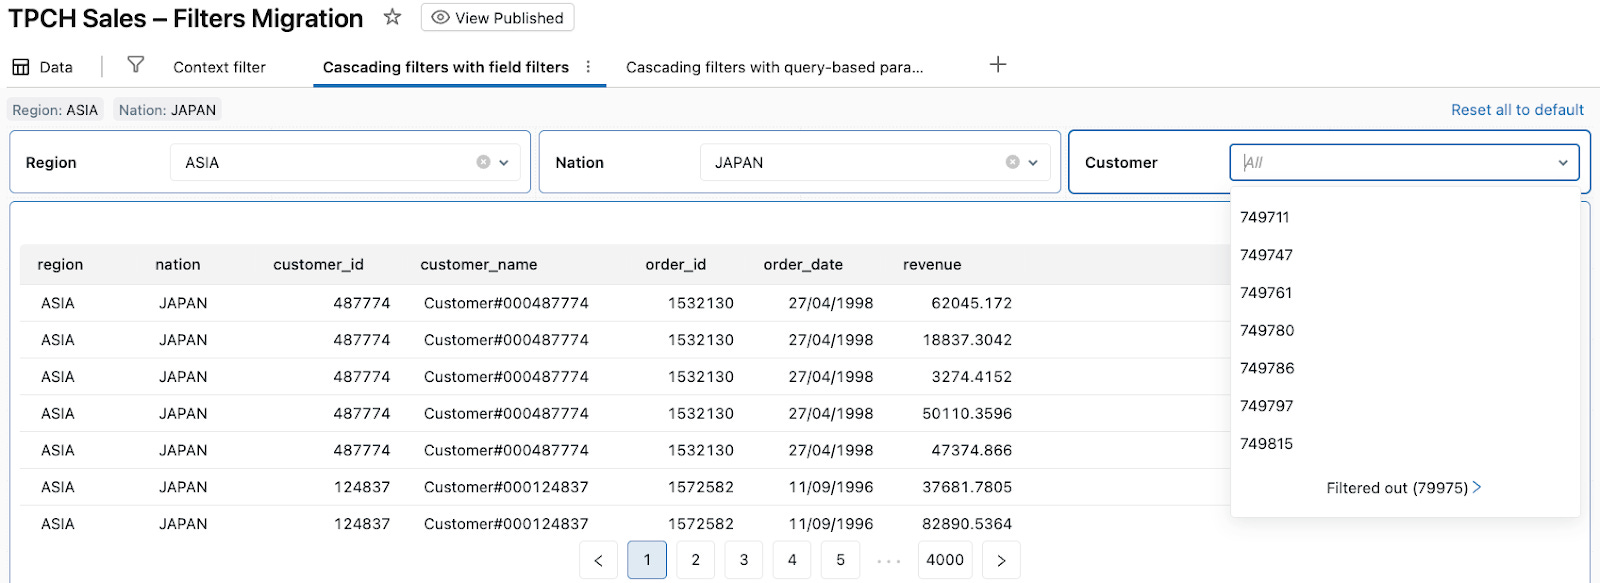
From the user’s perspective, these field filters behave like filters with an “Only Relevant Values” option enabled: each dropdown shows only values that exist in the currently filtered data. Under the hood, AI/BI Dashboards are simply applying field filters on top of a single dataset and recomputing the dropdown values from the currently filtered result set.
Pattern 2: Cascading filters with query-based parameters
In Pattern 1, we used field filters only. In some cases you may want more control over how dropdown values are loaded, or you may want the same parameter to drive multiple datasets. In that case you can use query-based parameters. A query-based parameter filter widget gets its dropdown values from a field in a “choices” dataset, and writes the selected value into one or more parameters that are used in dataset SQL.
Here we’ll build a three-level cascade Region → Nation → Customer using:
One main dataset: TPCH Sales (Cascading Pattern 2)
Three small “value list” datasets:
TPCH Regions (Cascading Pattern 2)
TPCH Nations by Region (Cascading Pattern 2)
TPCH Customers by Nation (Cascading Pattern 2)
In the companion dashboard, this pattern is implemented on the “Cascading filters with query-based parameters” page.
Step 1. Define TPCH Sales (Cascading Pattern 2)
Create the TPCH Sales (Cascading Pattern 2) dataset with parameters for region, nation, and customer:
SELECT
 r.r_name              AS region,
 n.n_name              AS nation,
 c.c_custkey           AS customer_id,
 c.c_name              AS customer_name,
 o.o_orderkey          AS order_id,
 o.o_orderdate         AS order_date,
 l.l_extendedprice * (1 - l.l_discount) AS revenue
FROM samples.tpch.region   AS r
JOIN samples.tpch.nation   AS n ON n.n_regionkey = r.r_regionkey
JOIN samples.tpch.customer AS c ON c.c_nationkey = n.n_nationkey
JOIN samples.tpch.orders   AS o ON o.o_custkey   = c.c_custkey
JOIN samples.tpch.lineitem AS l ON l.l_orderkey  = o.o_orderkey
WHERE (:region_param   = 'All' OR r.r_name = :region_param)
  AND (:nation_param   = 'All' OR n.n_name = :nation_param)
  AND (:customer_param = 0     OR c.c_custkey  = :customer_param);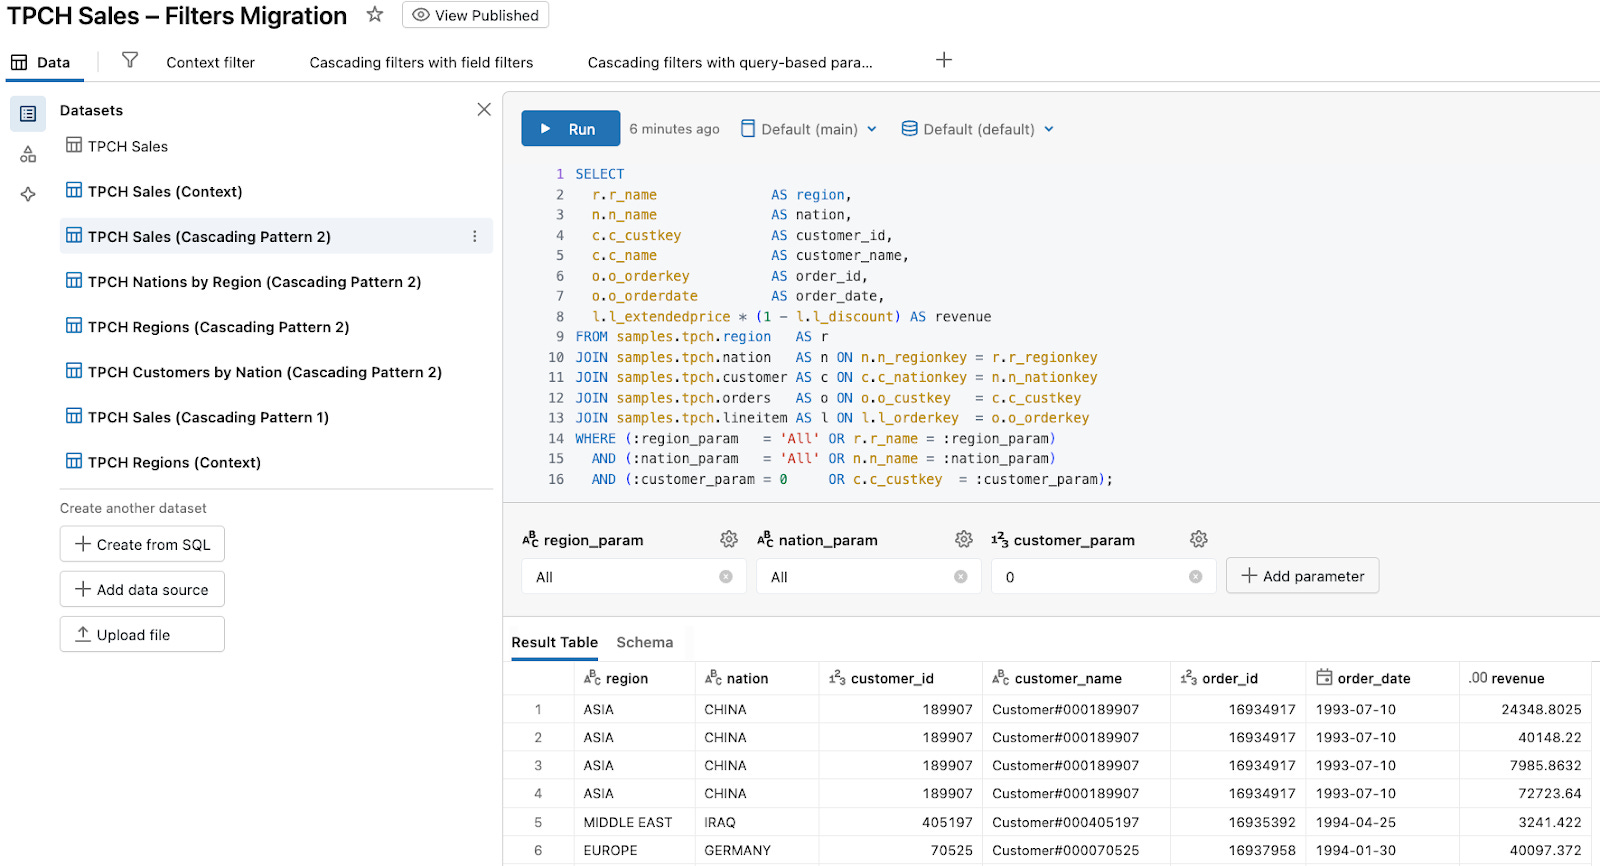
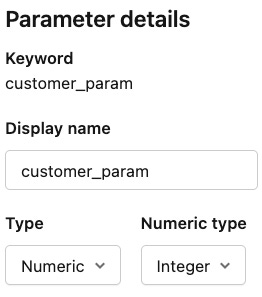
In the dataset’s Parameters panel:
Set
region_paramtype to String.Set
nation_paramtype to String.Set
customer_paramtype to Numeric / Integer (to matchc_custkey).
This last bit is important: the Customer filter uses a numeric field, so the parameter must be numeric as well.
Step 2. Create helper datasets for the dropdowns
1. TPCH Regions (Cascading Pattern 2) – list of regions:
SELECT DISTINCT r_name AS region
FROM samples.tpch.region
ORDER BY region;
2. TPCH Nations by Region (Cascading Pattern 2) – nations for the selected region:
SELECT DISTINCT n.n_name AS nation
FROM samples.tpch.nation   AS n
JOIN samples.tpch.region   AS r ON n.n_regionkey = r.r_regionkey
WHERE r.r_name = :region_param
ORDER BY nation;
This dataset defines its own region_param (string) in the Data tab.
3. TPCH Customers by Nation (Cascading Pattern 2) – customers for the selected nation:
SELECT DISTINCT
  c.c_custkey AS customer_id
FROM samples.tpch.nation   AS n
JOIN samples.tpch.customer AS c ON c.c_nationkey = n.n_nationkey
WHERE n.n_name = :nation_param
ORDER BY customer_id;
This dataset defines nation_param (string). customer_id is numeric, matching customer_param in TPCH Sales (Cascading Pattern 2).
Run each dataset in the Data tab once to confirm they succeed.
Step 3. Add Region, Nation, and Customer filter widgets
On your dashboard page, add three filter widgets and wire them to fields and parameters. Configure all three widgets as page-level filters (or move them into the global filters panel if they should apply across pages).
1. Region filter widget
Filter type: Single value
Fields:
TPCH Regions (Cascading Pattern 2).regionParameters:
TPCH Sales (Cascading Pattern 2).region_paramTPCH Nations by Region (Cascading Pattern 2).region_param
Default value:
All
This keeps region_param in TPCH Sales (Cascading Pattern 2) and TPCH Nations by Region (Cascading Pattern 2) in sync.
2. Nation filter widget
Filter type: Single value
Fields:
TPCH Nations by Region (Cascading Pattern 2).nationParameters:
TPCH Sales (Cascading Pattern 2).nation_paramTPCH Customers by Nation (Cascading Pattern 2).nation_param
Default value:
All
This keeps nation_param in TPCH Sales (Cascading Pattern 2) and TPCH Customers by Nation (Cascading Pattern 2) in sync.
3. Customer filter widget
Filter type: Single value
Fields:
TPCH Customers by Nation (Cascading Pattern 2).customer_idParameters:
TPCH Sales (Cascading Pattern 2).customer_param
Default value:
0
Effect
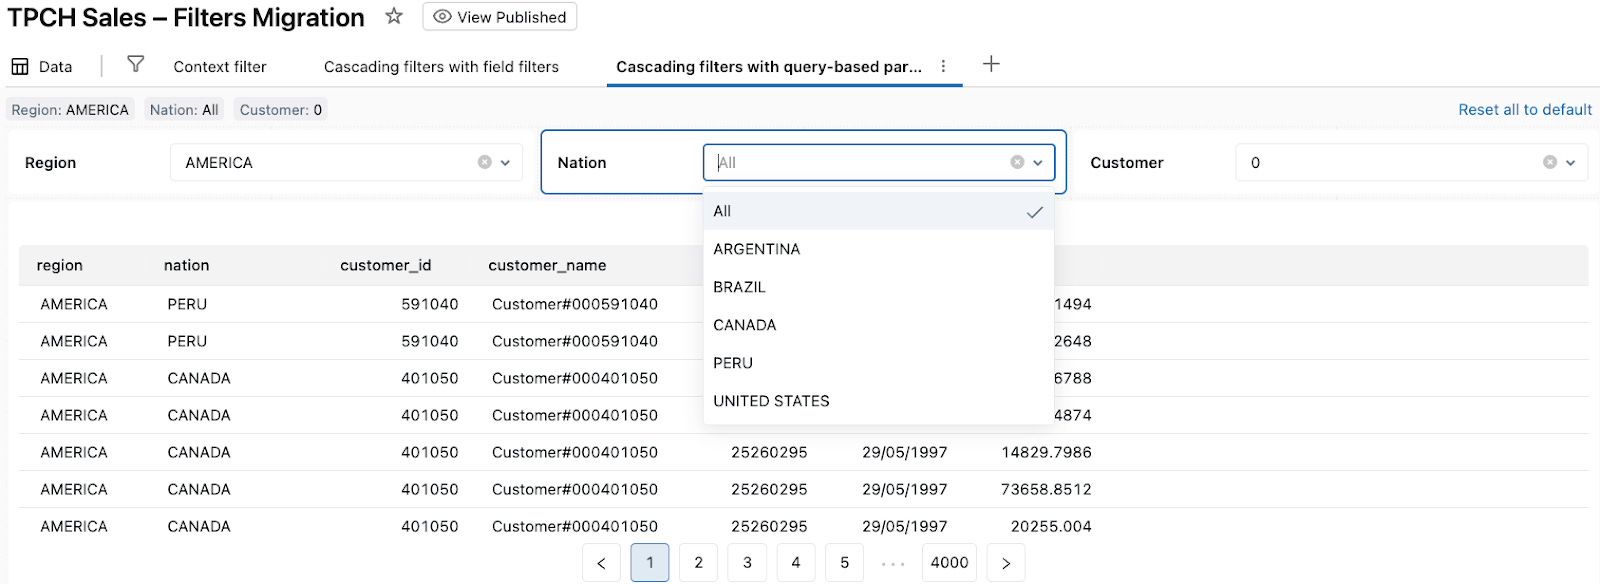
When a viewer selects Region: AMERICA:
The Region widget writes “AMERICA“ into
region_paramin TPCH Sales (Cascading Pattern 2) and TPCH Nations by Region (Cascading Pattern 2).TPCH Nations by Region (Cascading Pattern 2) reruns and returns only nations in AMERICA, so the Nation dropdown only shows those nations.
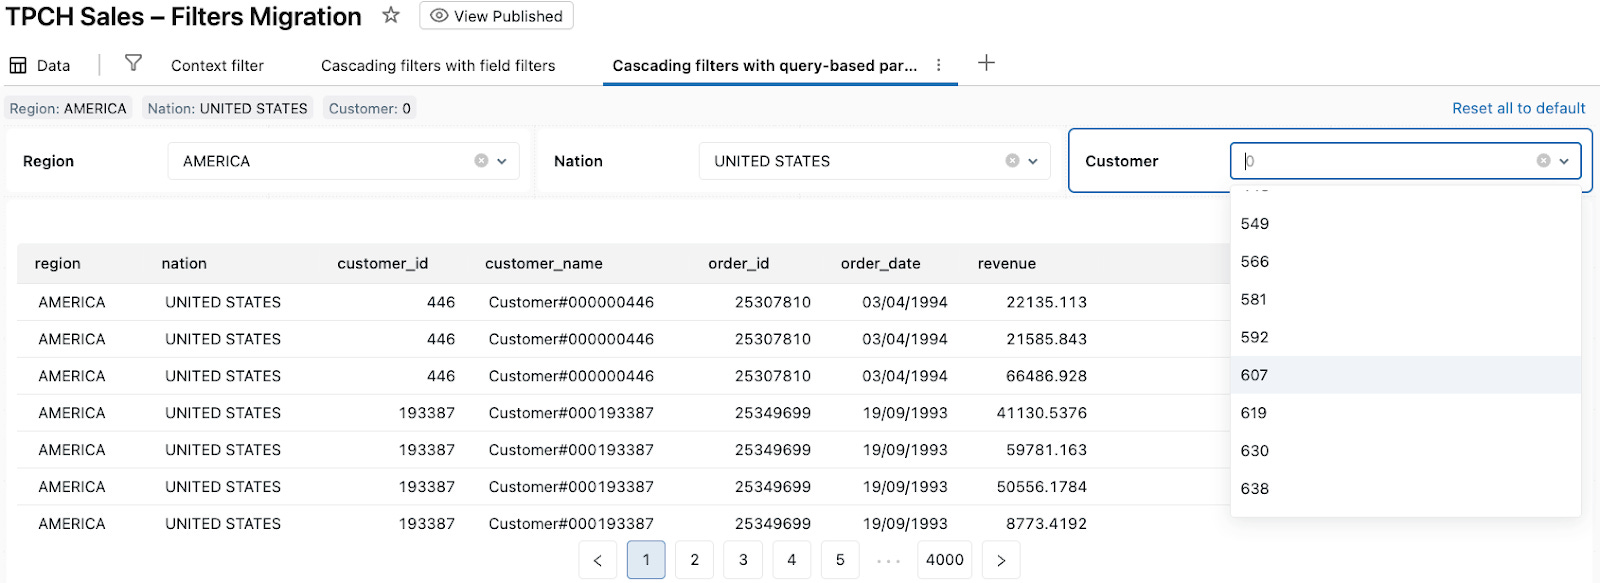
When the viewer then selects Nation: UNITED STATES:
The Nation widget writes “UNITED STATES“ into
nation_paramin TPCH Sales (Cascading Pattern 2) and TPCH Customers by Nation (Cascading Pattern 2).TPCH Customers by Nation (Cascading Pattern 2) reruns and returns only customers in UNITED STATES, so the Customer dropdown only shows those customer IDs.
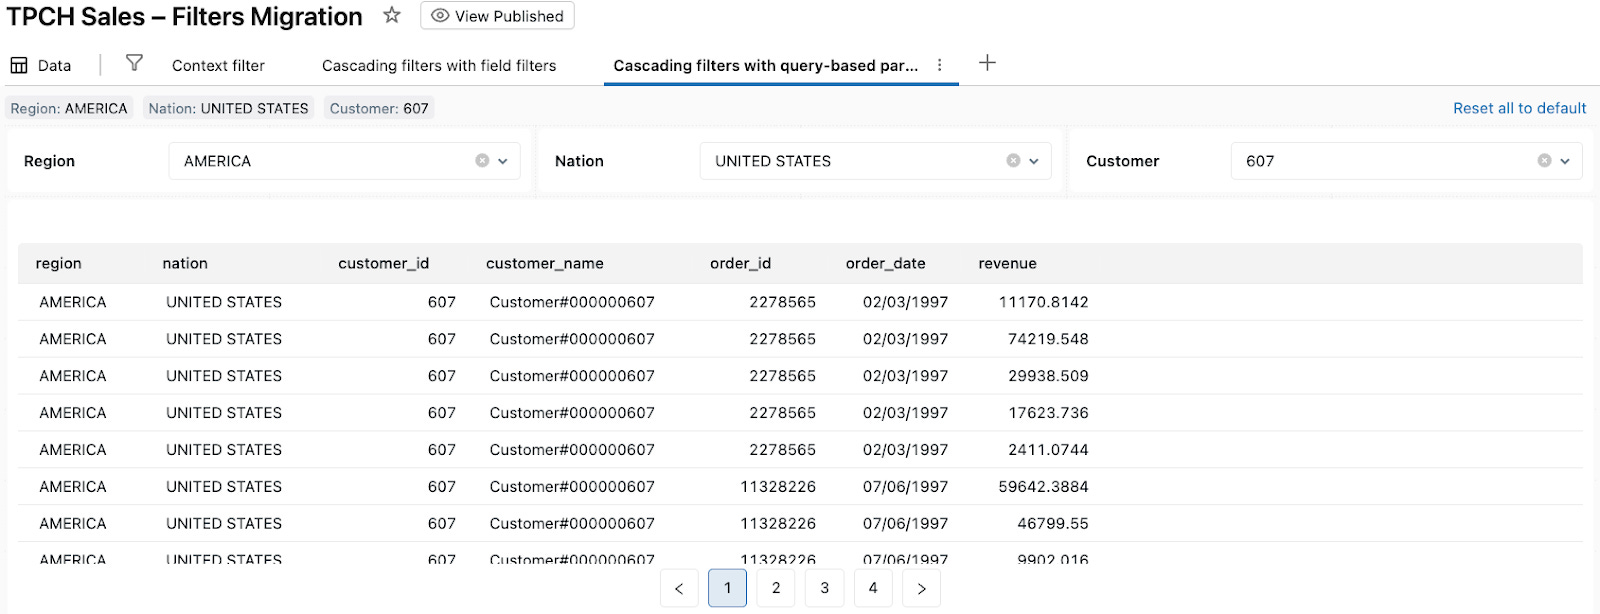
When the viewer selects a specific Customer (for example, 607):
The Customer widget writes 607 into
customer_paramin TPCH Sales (Cascading Pattern 2).TPCH Sales (Cascading Pattern 2) reruns with
region_param,nation_param, andcustomer_paramapplied, and all visuals built on this dataset show only orders for customer 607 in UNITED STATES / AMERICA.
From the viewer’s perspective, Region → Nation → Customer behaves like cascading filters with “Only Relevant Values” behavior enabled. Under the hood, each dropdown is a query-based parameter filter, and the Region and Nation widgets keep parameters in multiple datasets in sync, while Customer filters the main TPCH Sales (Cascading Pattern 2) dataset down to a single customer.
Which pattern when?
Both patterns get you “Only Relevant Values”-style cascading behavior, but they shine in different situations.
Pattern 1 – Cascading field filters
Use this when:
You’re working off one main dataset per page.
You want the simplest authoring experience: add field filters, connect them to the dataset, done.
“Allow All” and easy clearing of filters are important to your users.
This is the closest to what many BI tools do by default and is usually the right starting point.
Pattern 2 – Cascading query-based parameters
Use this when:
You need parameters that drive multiple datasets.
You want tighter control over dropdown values, including custom queries per level.
You’re comfortable managing parameter types and wiring filters to multiple datasets.
Pattern 2 is more flexible and explicit, but also more advanced. In practice, I start with Pattern 1 for most dashboards, and reach for Pattern 2 when I need parameter-driven logic or want to reuse the same parameters across several datasets and pages.
Summary
In this post, we looked at how to carry two of the most important filter patterns from traditional BI dashboards into Databricks AI/BI Dashboards:
Context filters become parameters in your dataset SQL, driven by parameter filter widgets. This lets you enforce “filter by Region first” semantics and shrink the working set before joins and aggregations.
“Only Relevant Values” / cascading filters can be implemented either with simple field filters on a single dataset (Pattern 1) or with query-based parameters and helper datasets (Pattern 2) when you need more control and reusable parameters.
The companion dashboard includes all three examples: a context filter page, a field-based cascading page, and a query-based cascading page. You can import it into your workspace and adapt the patterns to your own datasets.
In future posts, I plan to cover:
Row-level security and user-based filtering in AI/BI Dashboards
Action-style interactions such as cross-filtering and drill-through in AI/BI Dashboards
If you’re starting a migration from an existing BI tool to Databricks AI/BI today, I recommend:
Identify your key context filters (Region, Business Unit, etc.) and implement them as parameters in dataset SQL.
Start with Pattern 1 (field filters) for cascading behavior, and only move to Pattern 2 where you truly need parameter-driven logic or shared parameters across datasets.
These two patterns alone are usually enough to make an AI/BI dashboard feel as interactive and “alive” as the dashboards your teams are used to today.