


TL;DR
Use asynchronous checkpointing to UC Volumes with
UCVolumeWriterand checkpoint every 30 to 60 minutes to balance resilience against I/O overhead.Connect your local IDE (VS Code, Cursor) or terminal directly to AI Runtime GPUs via SSH tunnel for interactive development and debugging.
Use Genie Code for AI Runtime work. It natively understands your cluster, environment, and AI Runtime APIs, and more than doubled the success rate of leading coding agents on real data science tasks.
Productionize training with Declarative Automation Bundles (DABs) for version-controlled, CI/CD-friendly GPU workload deployments.
Run Ray Core, Ray Data, Ray Train, and Ray Tune natively on AI Runtime serverless GPU compute.
Monitor and attribute GPU spend using
system.billing.usagewith Serverless Usage Policies for team-level cost tracking.Migrate deep learning workloads from classic DBR ML to AI Runtime for on-demand GPUs, zero idle cost, and a simpler infrastructure experience.
This is a continuation of our blog that covers practical lessons we’ve learned from working with different customers shipping real GPU workloads on AI Runtime. Think of it as the “things we wish someone told us on day one” guide.
In Part 1, we covered hardware options, environments, entry points (notebooks, CLI, IDE), MLflow observability, and data loading.
In Part 2, we cover checkpointing, remote development workflows, Genie Code for AI Runtime, productionizing training runs, Ray on AI Runtime, migrating from classic DBR ML, and cost governance.
For the full Part 1, see Best Practices for GPU Workloads on Databricks AI Runtime — Part 1
6. Checkpointing: Make AI workloads resilient and resumable
Model Checkpointing
Use asynchronous checkpointing to UC volumes with UCVolumeWriter and PyTorch DCP to avoid blocking training. These backends stage data on fast local NVMe (/tmp) before uploading, which is faster than writing directly to FUSE and ensures metadata is only committed after all shards are uploaded.
Checkpoint frequently enough to limit lost work, but not so often that I/O slows training ,typically every 30–60 minutes. For async saves, initialize the process group with a CPU backend (e.g., cpu:gloo, cuda:nccl).
import torch.distributed.checkpoint as dcp

from serverless_gpu.data import UCVolumeWriter

checkpoint_path = “/Volumes/my_catalog/my_schema/model/checkpoints”

writer = UCVolumeWriter(checkpoint_path)

future = dcp.async_save(state_dict, storage_writer=writer)

# ...continue training...

future.result()  # blocks until the upload lands on the UC volume

# Load a checkpoint with UCVolumeReader

from serverless_gpu.data import UCVolumeReader

reader = UCVolumeReader(checkpoint_path)

dcp.load(state_dict, storage_reader=reader)
Data pipeline checkpointing
A model checkpoint captures model and optimizer state, but not the position of your data pipeline within the dataset, so a resumed run cannot fast-forward to the exact sample where it stopped. Account for this in how you resume: restart from an epoch boundary, or track processed samples or shards in your own training state so you can skip them on resumption.
7. Remote Development for AI Runtime: A local-to-Databricks workflow
You can connect your local IDE or terminal directly to AI Runtime serverless GPU compute using an SSH tunnel. This lets you interactively run and debug code from VS Code, Cursor, or the CLI while keeping a consistent environment between your local setup and the Databricks workspace.
Tools like Cursor and VS Code (with the Remote SSH extension) work out of the box. Other coding agents like Claude Code can also be used once the SSH tunnel connection is active.
Setup is straightforward. Establish the connection via a single command in the Databricks CLI:
databricks ssh connect --accelerator <GPU_type> where <GPU_type> can be set to GPU_1xA10 or GPU_8xH100
To launch directly into your IDE, add the --ide vscode or --ide cursor parameter. You can also launch the tunnel through the latest release of the IDE extension.
Note that the SSH tunnel gives you an interactive session on a single node. For long-running training jobs or multi-node distributed training, use the AIR CLI instead (covered in Part 1).
Additional capabilities to simplify using your preferred IDE as your primary development environment:
Handling project dependencies: Use the --base-environment option to start the SSH connection with pre-configured Python libraries from a workspace base environment.
Tracking costs and resource utilization: Apply a serverless usage policy using the
--usage-policy-idparameter to attribute SSH connection costs across teams or projects.Exploring data assets via Unity Catalog: Inspect catalogs, schemas, and resources directly within the IDE without leaving your development workflow.
File persistence: Files under
/Workspace, /Volumes, and/dbfspersist across restarts. Anything in/homeor/rootis ephemeral.
8. Genie Code: Build AI Runtime notebooks and jobs faster
Genie Code is the AI coding and data assistant built into the Databricks workspace. It has a deep, native understanding of the Databricks platform including your data assets, lineage, governance policies, compute environment, and runtime context. It’s equipped with the latest Databricks-specific skills and APIs that general-purpose coding agents don’t have access to, and its agentic harness is purpose-built for the full spectrum of Databricks workloads, from data engineering and analytics to ML training and production operations.
The result: on real-world data science tasks, Genie Code more than doubled the success rate of a leading coding agent, even when that agent was connected to Databricks via MCP.
When to Use Genie Code vs. Other Assistants
If the work touches Databricks, start with Genie Code. For everything else, use whatever you’re already productive with, whether that’s Claude Code, Cursor, or Copilot. They’re great for general software engineering, building apps, and working across repos. These tools aren’t competitors, they’re complementary.
If Genie Code can’t be used, connect your preferred coding agent to Databricks using MCP and the open-source Databricks AI Tools. It won’t match Genie Code’s native depth, especially on AI Runtime, but it brings meaningful Databricks awareness to tools like Claude Code, Cursor, or Copilot.
Leveraging Genie Code for AI Runtime Development
Genie Code can help you develop and troubleshoot deep learning workloads in notebooks connected to AI Runtime. It can generate distributed training code, resolve environment and dependency issues, and investigate GPU workload failures.
Steps to use Genie Code with AI Runtime:
Connect the notebook to AI Runtime and open the Genie Code pane (Genie lamp on top right)
Describe the model training workload that you want to develop or the problem that you want to resolve.
Here are some example Genie code prompts for the following use cases to get you started
Develop distributed training workloads:
“Adapt this training workload for AI Runtime and explain the important changes.”
Resolve environment and dependency issues:
“Diagnose this package compatibility error and recommend the smallest appropriate change.”
Debug GPU and distributed workloads:
“Analyze this failed distributed training run using the available output from every rank and identify the root cause.”
For more details refer to the Use Genie Code with AI Runtime documentation.
9. Productionize: take your training to production
Once your training code is working in a notebook, the next step is making it reproducible, scheduled, and deployable across environments. Databricks supports this through Declarative Automation Bundles (DABs), which let you define your AI Runtime training workload as code. In Part 1, we covered the AIR CLI for submitting training jobs. DABs are the next step when you need version-controlled, CI/CD-friendly deployments.
The ai_runtime_task is a job task type purpose-built for this. You point it at your training code, specify the GPU type and count, and declare your dependencies, all in a YAML bundle definition that lives in source control. From there, you can deploy to dev or production with a single CLI command, schedule it on a cadence, and compose it with other tasks like data preparation steps that run on CPU.
Key things to know:
Your training code can be packaged as a tgz artifact and shipped with the bundle, or referenced directly from a workspace or volume path.
Multi-node runs are supported. Set accelerator_count higher than the per-node GPU count and AI Runtime handles the distributed environment variables (WORLD_SIZE, MASTER_ADDR, etc.) for you.
GPU and CPU tasks can be combined in multi-task jobs using
depends_on, so you only use GPU time for actual training. Note thatai_runtime_taskdoes not support job task values for passing data between steps, so use a shared location like a UC volume instead.Dev to production promotion works the same way as any other Databricks bundle. Schedules are paused by default, so deploying won’t accidentally trigger runs.
For the full configuration reference, task fields, and a complete working example, see the Productionize training workloads documentation.
10. Ray on AI Runtime: Practical scaling with Ray Core, Ray Data, Ray Train and Ray Tune
Ray is a popular framework for scaling Python workloads. Databricks AI Runtime supports Ray natively, so you can create Ray clusters and run Ray applications on serverless GPU compute without managing infrastructure.
AI Runtime supports Ray’s main libraries, including Ray Core, Ray Data, Ray Train, and Ray Tune. The Databricks AI environment includes Ray out of the box. With the Standard environment, add ray or the relevant extra (ray[data], ray[train], ray[tune]) to your workload dependencies.
Use Ray in notebooks
For single node, use ray_init() from the serverless_gpu package to start Ray on the notebook attached to AI Runtime compute:
from serverless_gpu import ray_init
ray_init()
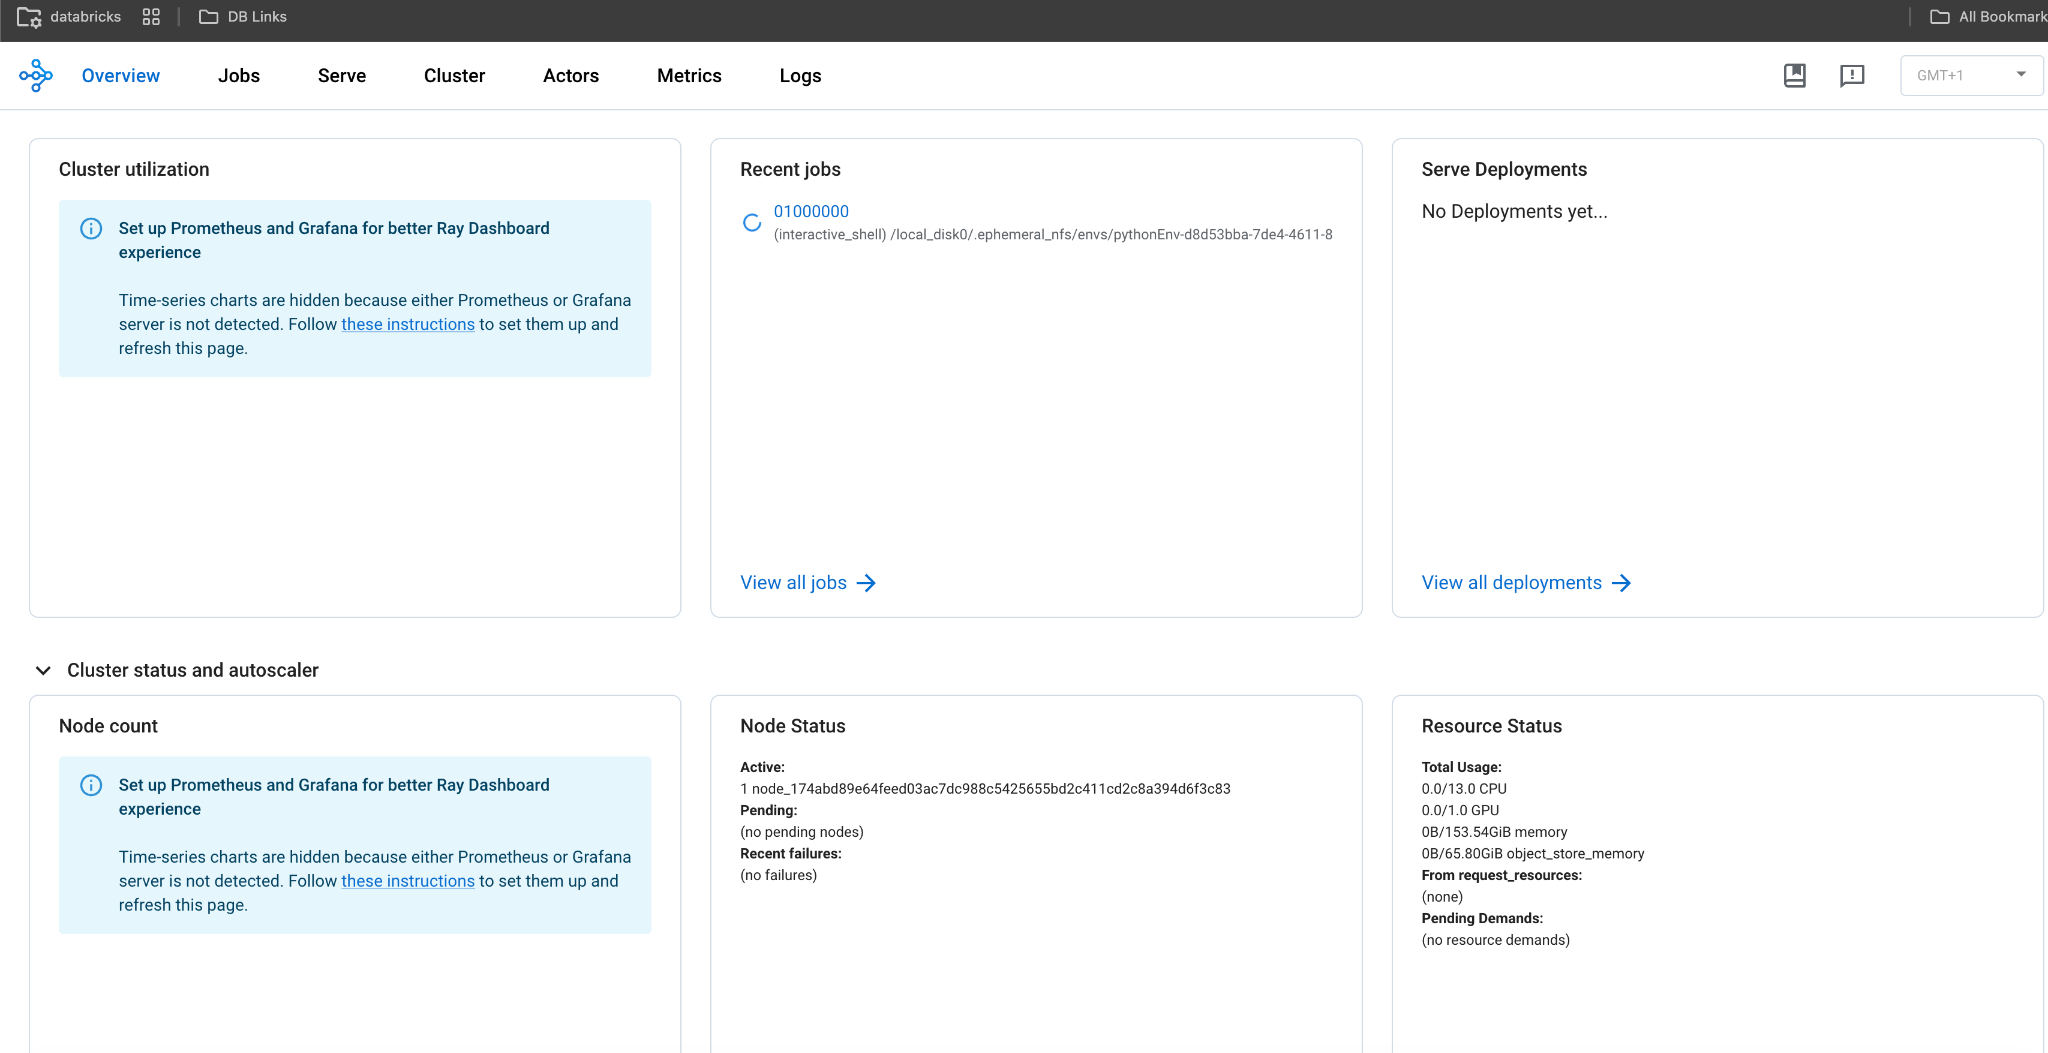
Ray Dashboard: ray_init() automatically configures the Ray dashboard and prints the dashboard URL in the notebook output. Use the dashboard to inspect Ray jobs, tasks, and resource usage while your code runs. This is in addition to the MLflow System Metrics and Model Metrics monitoring you get for AI Runtime runs.
Use Ray with the AI Runtime CLI
The AI Runtime CLI supports Ray in single-node and multi-node configurations. Include a bootstrap script under the workload’s command, which starts the Ray cluster and coordinates head and worker nodes when the workload launches.
For Ray examples with CLI, refer to the AI Runtime Ray documentation.
11. Migrate GPU workloads from Classic DBR ML to Databricks AI Runtime
Databricks AI Runtime is the recommended compute for GPU workloads.
If you’re still on classic DBR ML, here are the key steps to migrate deep learning workloads to AIR:
Replace cluster-dependent code. Remove any references to Spark-based distributed training (for example, TorchDistributor) and replace them with the
@distributeddecorator fromserverless_gpu. Or you can go for the air cli approach.Reinstall dependencies. Do not rely on Databricks Runtime ML pre-installed libraries. Add explicit
%pip installcommands for all required packages with exact versions.Update data loading.
Replace direct DBFS paths with Unity Catalog volumes paths.
Replace local Spark DataFrame operations with Spark Connect.
For streaming file-based data from volumes, use UCVolumeDataset from
serverless_gpu.data.
Update checkpoint paths.
Move checkpoints from DBFS or local storage to Unity Catalog volumes.
For distributed checkpointing, use
UCVolumeWriterandUCVolumeReaderfromserverless_gpu.data, which stage I/O through local NVMe.
Update MLflow configuration. Ensure experiment names use absolute paths and configure run names so they can be easily restarted.
Test interactively first. Validate your workload in an interactive notebook before scheduling it as a job.
Several of these steps, such as environments, data loading, checkpointing, and MLflow configuration, are covered in detail earlier in the blog. Refer to those sections for deeper guidance.
Recommendation: Use Genie Code to accelerate the migration. It understands both the classic DBR ML patterns you’re moving from and the AI Runtime APIs you’re moving to, so it can help rewrite your training code, resolve dependency conflicts, and test the result in your live environment.
12. Cost and Usage: Measure, govern, and optimize GPU compute
AI Runtime will appear on your bill as DBUs on the Model Training SKU. The DBUs will be based on the number of GPU hours and the GPU type selected.
You can view on-demand pricing for the available GPU instance types in your cloud provider and region on the Databricks AI Runtime pricing page.
You can monitor your AI Runtime GPU spend by querying the billable usage system table (system.billing.usage).
The following query returns total usage for serverless GPU workloads:
SELECT SUM(usage_quantity)

FROM system.billing.usage

WHERE product_features.serverless_gpu IS NOT NULL
Spend by team and model (via custom tags):
SELECT custom_tags[’team’]  AS team,

       custom_tags[’model’] AS model,

       SUM(usage_quantity)  AS gpu_hours

FROM   system.billing.usage

WHERE  product_features.serverless_gpu IS NOT NULL

  AND  usage_date >= current_date() - INTERVAL 7 DAYS

GROUP  BY team, model

ORDER  BY gpu_hours DESC;
Tips
Create Serverless Usage Policies with tags for team, project, or model so GPU spend is attributable from day one. These tags propagate automatically to
system.billing.usagein thecustom_tagscolumn.For notebooks, select the usage policy from the compute dropdown. For AIR CLI jobs, set
usage_policy_namein your workload YAML. For DABs jobs, set it in the job details.Build a Lakeview dashboard on top of these queries for weekly cost review. Databricks also offers a pre-built cost monitoring dashboard that account admins can import.
That covers it. Across Part 1 and Part 2, we’ve covered the full lifecycle of GPU workloads on AI Runtime. From choosing the right entry point, hardware, and environment, to data loading, distributed training, and observability in Part 1, through to checkpointing, developer experience, productionizing, and cost governance in Part 2. Everything here comes from design patterns we’ve seen work across real teams shipping real workloads.
We hope it gives you a practical understanding of how to make the best use of AI Runtime for your use cases. If you’re just getting started, pick the section most relevant to you and build from there. And as AI Runtime continues to evolve, we’ll keep updating these guides with what we learn.
Thanks for reading. Feel free to share any feedback on topics you’d like to see next in the comments section.