


TL;DR
Choose the right entry point: use notebooks with the
@distributeddecorator for rapid prototyping, and switch to the AIR CLI with YAML-based configs for long-running, multi-node production training.Pick the right accelerator for the job: attach a low-cost A10 or single H100 for orchestration, and reserve multi-GPU or multi-node H100 configurations for actual training workloads.
Use
UCVolumeDatasetandserverless_gpu.data.DataLoaderfor efficient data loading with local caching, automatic distributed partitioning, and optimized prefetching keep GPUs fed without Spark overhead.Enable MLflow autologging and monitor the System Metrics tab for GPU utilization and memory; set a custom run name and
MLFLOW_RUN_IDto resume previous training runs.
This post covers the practical lessons we’ve learned from working with teams in Databricks and with customers shipping real GPU training workloads. Think of it as the “things we wish someone had told us on day one” guide.
If you’re training or fine-tuning deep learning models on Databricks, AI Runtime is how you get access to GPUs without the usual infrastructure headaches. But like any powerful tool, knowing how to use it well makes all the difference.
Update: You can find Part 2 of this blog here.
What is AI Runtime? How Can It Help?
AI Runtime is a serverless model training product at Databricks built specifically for deep learning workloads. It brings GPU support to Databricks Serverless, so you can train and fine-tune models using your favorite frameworks (PyTorch, DeepSpeed, vLLM, Ray, etc.) without managing any infrastructure.
Before AI Runtime, running GPU workloads meant configuring clusters, picking the right drivers, managing autoscaling, and often negotiating GPU capacity directly with your cloud provider (AWS, Azure, or GCP). AI Runtime takes all of that off your plate.
Key benefits:
Fully managed GPU infrastructure: You request the GPUs you need and start working. Pay only for what you use. On-demand by nature.
Seamless scaling. Go from a single GPU experiment to multi-node distributed training without reconfiguring anything.
A runtime dedicated for deep learning: Choose either a minimal base environment for full control over your dependencies, or a full-featured AI environment pre-loaded with popular ML frameworks. Either way, CUDA, NCCL, and drivers are already set up. For multi-node H100s, RDMA networking is configured out of the box.
Natively integrated across notebooks, jobs, Unity Catalog, and MLflow. Your development workflow, data access, experiment tracking, and governance all work together.
Here are the 5 AI Runtime best practices we will cover in this Part 1 blog. Feel free to jump directly to the section that’s interesting for you:
What are my hardware accelerator options?
What are environments in AI Runtime?
What are the 3 ways of using AI Runtime- notebooks, CLI and IDE?
How can I use MLflow for tracing and observability?
What are the different options for data loading for training?
1. Hardware Accelerator Options
The following accelerators are currently supported. All accelerators provision a single node.
1xA10- 24 GB-Small to medium ML and deep learning tasks1xH100- 80 GB- Workloads that need more GPU memory than1xA10provides but do not require multi-GPU distributed training.8xH100- 80 GB per GPU- Large-scale AI workloads that need distributed training or multiple GPUs
For multi-GPU workloads, choose a single-node 8xH100 instance (one node with 8 H100 GPUs). Partial multi-GPU configurations like 2xH100 or 4xH100 are not supported though.
For multi-node workloads, scale out using multiple 8xH100 nodes; for example, 4 nodes with 8 H100 GPUs each give you a total of 32 H100 GPUs. Or you can use multiple nodes of 1xA10.
Besides the options listed above, be sure to consult the latest documentation, as additional accelerator types may become available over time.
2. Environments
AI Runtime offers two managed Python environments, the default base environment and the Databricks AI environment.
Default base environment
Minimal, includes only required packages: torch, cuda, and torchvision
You want full control over your dependency stack and prefer to install only what you need
Databricks AI environment
Pre-loaded with popular ML frameworks (PyTorch, Transformers, and more)
You want a complete environment for training, fine-tuning, and experimentation without manual dependency management
You can also use a workspace base environment that a workspace admin has built for serverless GPU compute.
Environment Caching: Environments are cached across sessions to speed up startup times. When you reconnect to AI Runtime with the same environment configuration, previously installed packages may be available from cache, reducing setup time. However, this behavior is not guaranteed, so always ensure your notebook includes the necessary %pip install commands for reproducibility..
Import custom modules: Import custom modules by placing them under /Workspace/shared and adding the path to sys.path. Or You can also upload module files as Workspace files and import them directly.
import sys

sys.path.append(”/Workspace/Shared/my-project/src”)

from my_module import my_function
Some differences as compared to Classic Compute:
Spark: AI Runtime is a Python-only environment; Spark is not available as a local runtime. So you cannot use PySpark functions but you can use Spark Connect for data loading.
MLR: Pre-installed AI Runtime packages do not fully replace Databricks Runtime ML, because some ML libraries available in Databricks Runtime ML are not included.
3. Main Ways to Get Started: Notebooks, CLI and IDE
You have two primary ways for running workloads on AI Runtime: Notebooks and AIR CLI. Each has its strengths, and picking the right one for your use case makes the journey easier.
3a. Notebooks
Notebooks on AI Runtime let you develop interactively, iterate quickly, and visualize results in place. Simply choose your preferred accelerator (A10, 1×H100, or 8×H100), attach it to your notebook, and your code will execute directly on that GPU-backed node.
Multi-GPU (Single Node)
To run jobs across multiple GPUs on a single node, use the @distributed decorator. Wrap your training workflow inside a function and apply the decorator to it. This function becomes the entry point for distributed execution, so all the components - model initialization, data loading, and training logic - should be defined within it.
The @distributed API integrates with major distributed training libraries: PyTorch, DDP, FSDP and DeepSpeed
@distributed(gpus=8, gpu_type=’H100’)

def run_train(num_epochs, batch_size):

    # training code here


run_train.distributed(num_epochs=3, batch_size=1)
Ray
For a single node (A10 or 8xH100), you can just use ray_init from serverless_gpu
from serverless_gpu import ray_init;

ray_init()
For multi-node, use air CLI.
Best practices:
Pin your library versions: AI Runtime has regular releases. If you need reproducibility, pin the versions that work for your code.
For distributed training, any environment variable needed by your training code should be set within
@distributed. Note: Some environment variables must be set before importing a particular library so that it initializes with the correct configuration and hardware settings. This is specific to the library, not AI runtime.Keep experimentation in notebooks, production in jobs: Notebooks are great for prototyping and debugging, but once your code is stable, you can move it to a scheduled job. For scheduling notebook jobs, use the Jobs API or Declarative Automation Bundles (fka Databricks Asset Bundles)
For operations that do not require GPUs (for example, converting data formats, or exploratory data analysis), attach your notebook to a CPU cluster to preserve GPU resources.
Note: Connection to your interactive compute auto-terminates after 60 minutes of inactivity.
3b. AI Runtime CLI
air CLI is a command-line tool for submitting and managing training jobs on Databricks Serverless GPU compute directly from your terminal, instead of using notebooks.The CLI uses YAML-based job configuration, and supports workspace-based and git-based code workflows. It’s aimed for users who prefer repos, IDEs, git, and CI/CD-style workflows over notebooks.
air CLI follows a simple submit → schedule → execute → observe loop:
Define your workload in a
train.yamlfile (compute shape, environment, launch command).Submit via
air run -f workload.yamlAIR automatically provisions the requested GPU nodes, installs dependencies from requirements.yaml, and injects coordination environment variables
Your training code runs (e.g., via torchrun) across the provisioned nodes.
Observe progress through
air get logs,air get status, or the MLflow UI for GPU metrics.
Here is a simple train.yaml
experiment_name: simple-training

environment:

  dependencies: requirements.yaml

env_variables:

  NCCL_DEBUG: “INFO”

secrets:

  HF_TOKEN: ‘my_scope/hf_token’

compute:

  num_accelerators: 8

  accelerator_type: GPU_8xH100

code_source:

  type: snapshot

    snapshot:

      root_path: /home/username/repo

      git:

        branch: main

command: torchrun --nproc_per_node=8 train.py

max_retries: 2

timeout_minutes: 90

usage_policy_id: abcd123-25b8-3e87-9a2c-f86eb19d101c
Here is the doc for AI CLI for more information.
Best practices for AIR CLI:
Use CLI for multi-node, long-duration jobs: If your training run takes hours or days and spans multiple nodes, AIR CLI is the right tool. It handles the orchestration cleanly.
Treat the workload.yaml as the source of truth. Keep the launch definition in version-controlled YAML rather than relying on notebook/UI state, so runs are easier to reproduce, hand off, and compare later.
Check
workload.yamland requirements.yaml into your repo along withtrain.pyfor version tracking and reproducibility.
Custom Docker Images: You can run your own Docker images with AI Runtime using a simple CLI and YAML-based configuration. This is useful for workloads that need specific libraries, complex dependencies, fully reproducible environments, or standard images defined by your organization.
When to use AIR CLI vs. Notebooks:
Use notebooks (with the @distributed decorator) for rapid iteration and prototyping.
Use the AI Runtime CLI when you need to:
Submit GPU training jobs directly from your terminal.
Define jobs in YAML for version control and reproducibility.
Run long (multi-day) or distributed (multi-node) training that shouldn’t depend on an interactive session.
3c. Connecting from the IDE terminal like Visual Studio or Cursor
You can connect to AI Runtime on serverless GPU compute directly from a terminal in your IDE through an SSH tunnel.
To connect from a terminal within your IDE, run the databricks ssh connect command with the --accelerator option.
databricks ssh connect --accelerator=GPU_1xA10
To connect and start the session in Visual Studio Code or Cursor, use the --ide option. The CLI opens an IDE window pointing to the home workspace folder.
databricks ssh connect --ide=vscode
4. Use MLflow for Tracking and Observability
On AI Runtime, MLflow is the main place to track and inspect training runs. AIR is natively integrated with MLflow for experiment tracking, model logging, metric visualization, and observability.
It’s recommended to use the latest version of mlflow (minimum 3.7 version)
For each run of your experiment:
The System Metrics tab provides an overview of GPU, CPU, and disk performance, including key metrics such as utilization and memory usage. These are generated automatically for each run. Use these metrics to proactively identify bottlenecks, tune workloads (for example by adjusting batch size or data loading), and ensure resources are right-sized so you maintain high utilization without over-provisioning
The Model Metrics tab surfaces key performance indicators logged during training, such as accuracy, loss, and other task-specific scores. Use these metrics to validate and compare experiments, ensuring that changes to model architecture, training configuration (for example, batch size, learning rate, and data preprocessing),etc actually improve model quality over time/
Logs for processes running on each GPU are stored as artifacts and can be accessed from the MLflow UI. For notebook-based runs, the same logs are also visible directly in the notebook cell outputs. Use these logs to monitor training progress, debug training issues, and trace performance regressions across runs so you can quickly identify and fix problems in your training pipeline.
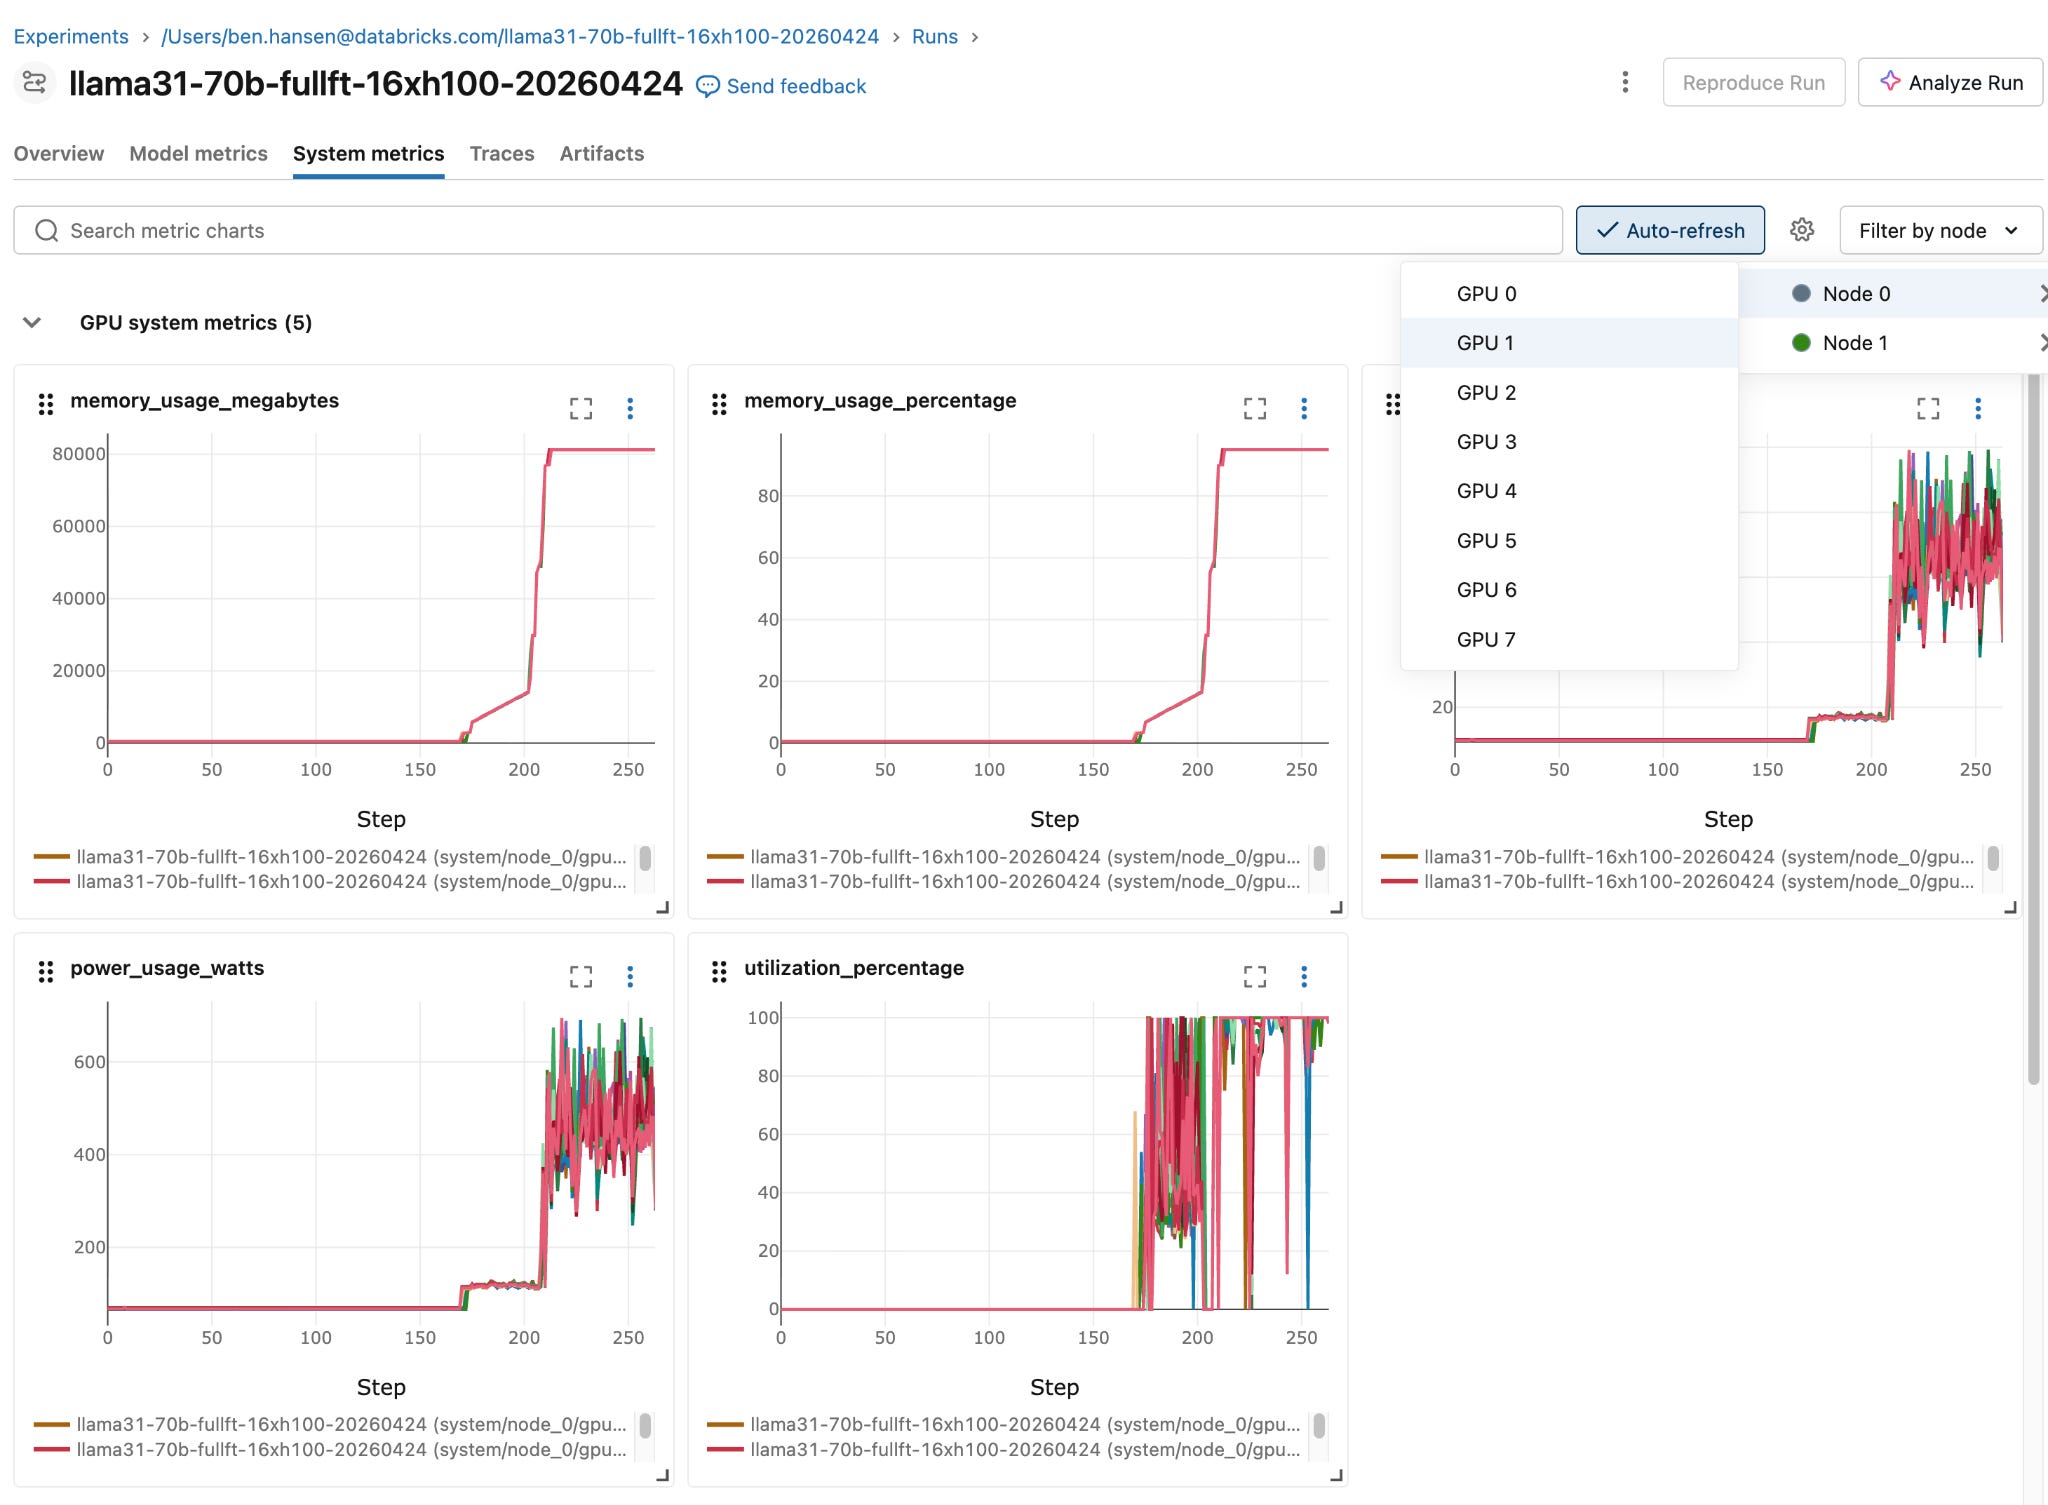
System Metrics
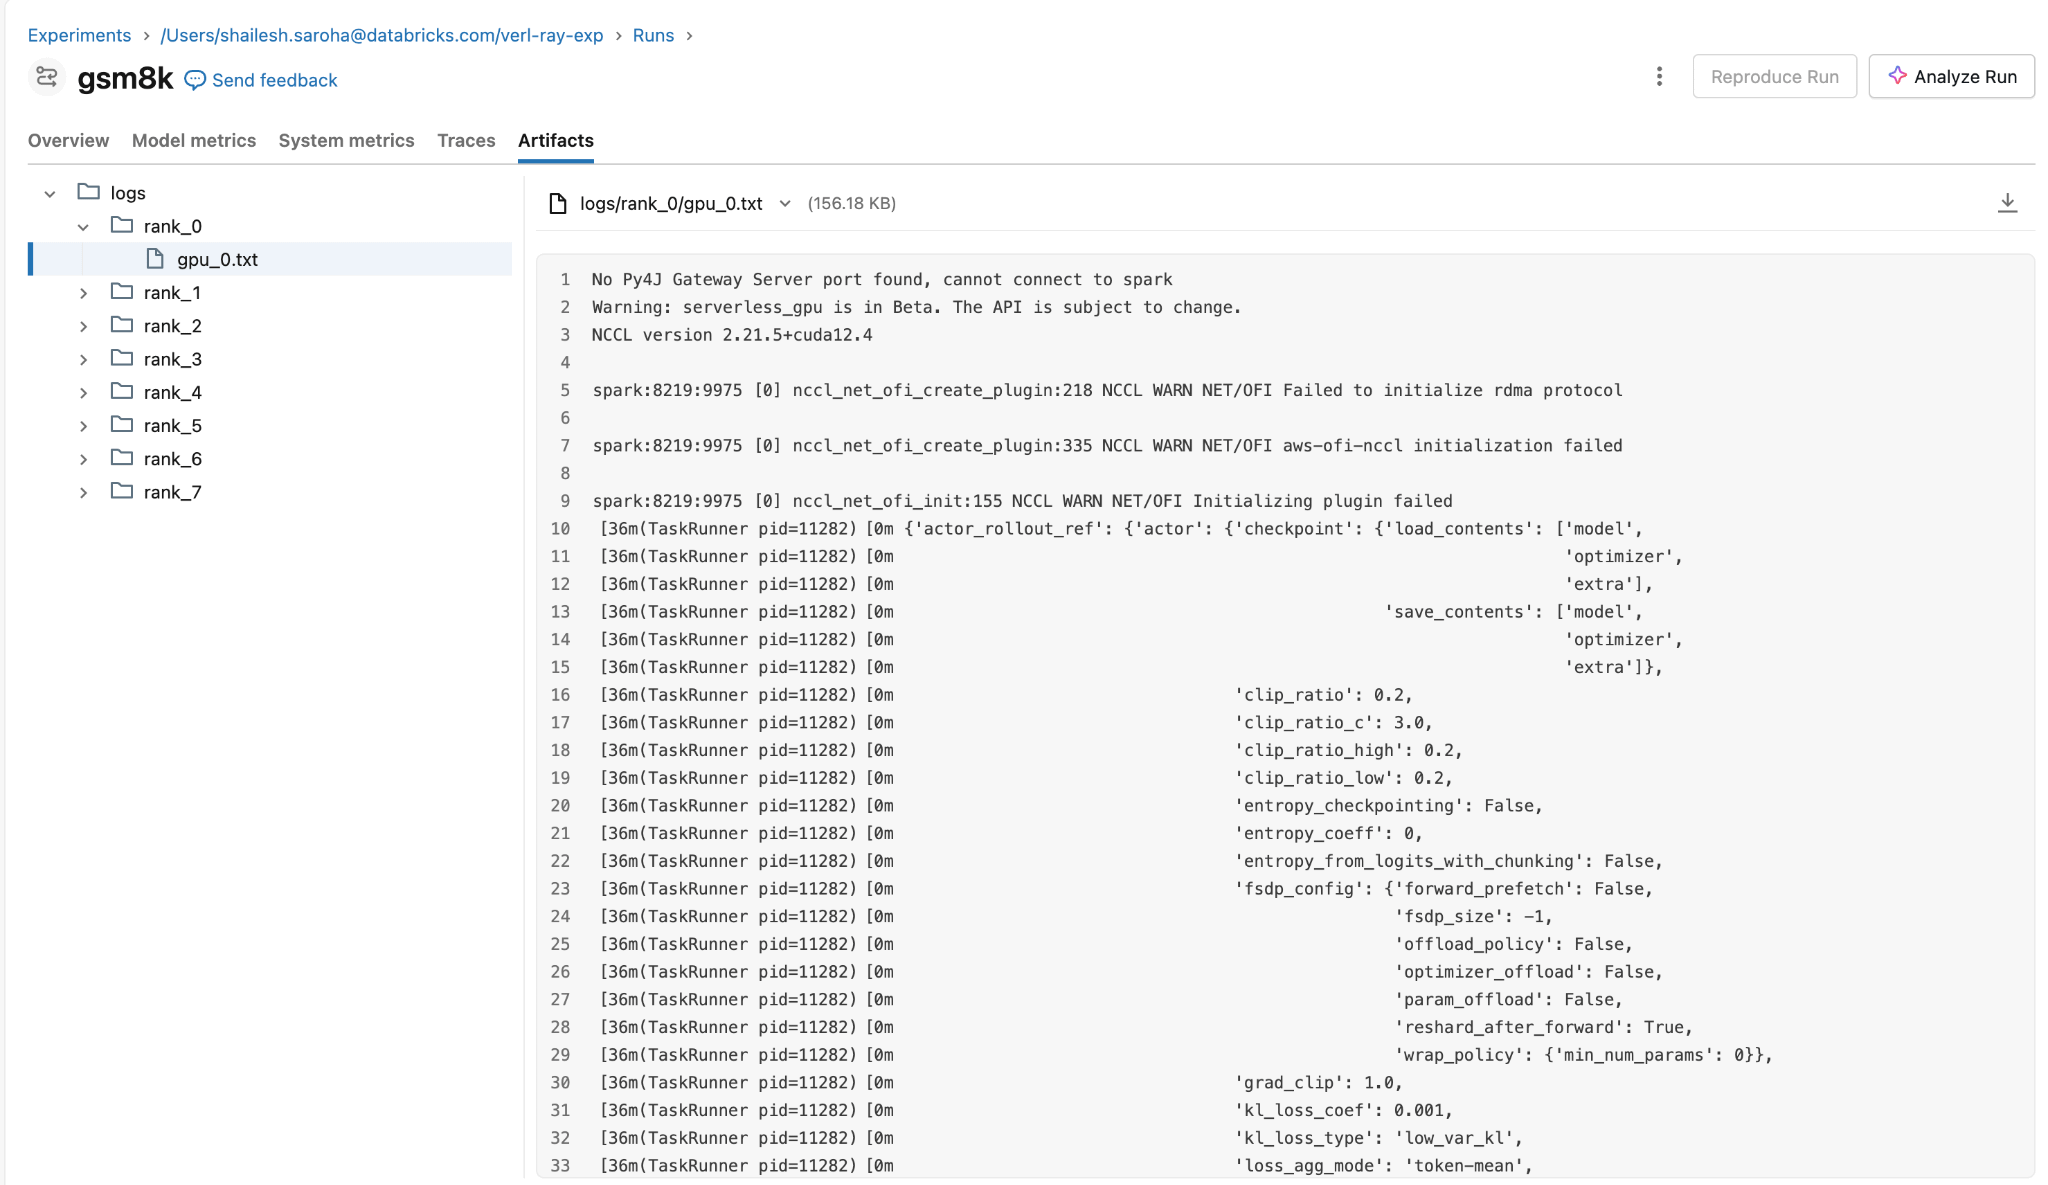
Logs are also available as artifacts in the MLflow run
Best practices:
Autologging: MLflow supports automatic logging for popular frameworks like PyTorch, TensorFlow etc. You can enable it for your training job by adding just one of code,
mlflow.autolog(). It automatically captures:Metrics: standard training and evaluation measures (such as accuracy and F1 score);
Parameters: hyper-parameters, such as learning rate and number of estimators
Artifacts: output files, such as your trained model weights.
Manual Logging: you can manually log any parameter, metric or artifact in your training code.
The Serverless GPU API automatically launches an MLflow experiment with default name /Users/{WORKSPACE_USER}/{get_notebook_name()}. To overwrite it, set
import os

os.environ[”MLFLOW_EXPERIMENT_NAME”] = “/Users/<username>/my-experiment”
It’s recommended to customize the MLflow run name. It enables you to restart from a previous run.You can customize the run name using the run_name parameter in
mlflow.start_run(run_name=”your-custom-name)or in third-party libraries that support MLflow (for example, Hugging Face Transformers). Otherwise, the default run name isjobTaskRun-xxxxx.Resume previous training by setting the MLFLOW_RUN_ID from the earlier run:
mlflow.start_run(run_id=”<previous-run-id>”)Set the `step` parameter in MLFlowLogger to reasonable batch numbers. MLflow has a limit of 10 million metric steps, so logging every single batch on large training runs can hit this limit
Monitor GPU resources:
If you are using Notebook, you can use GPU resources in the right side pane to monitor GPU health and utilization while your code runs on AI Runtime. The pane supports both single-node and multi-node workloads. The pane displays the following metrics for each GPU: GPU utilization percentage, GPU memory usage, Temperature.
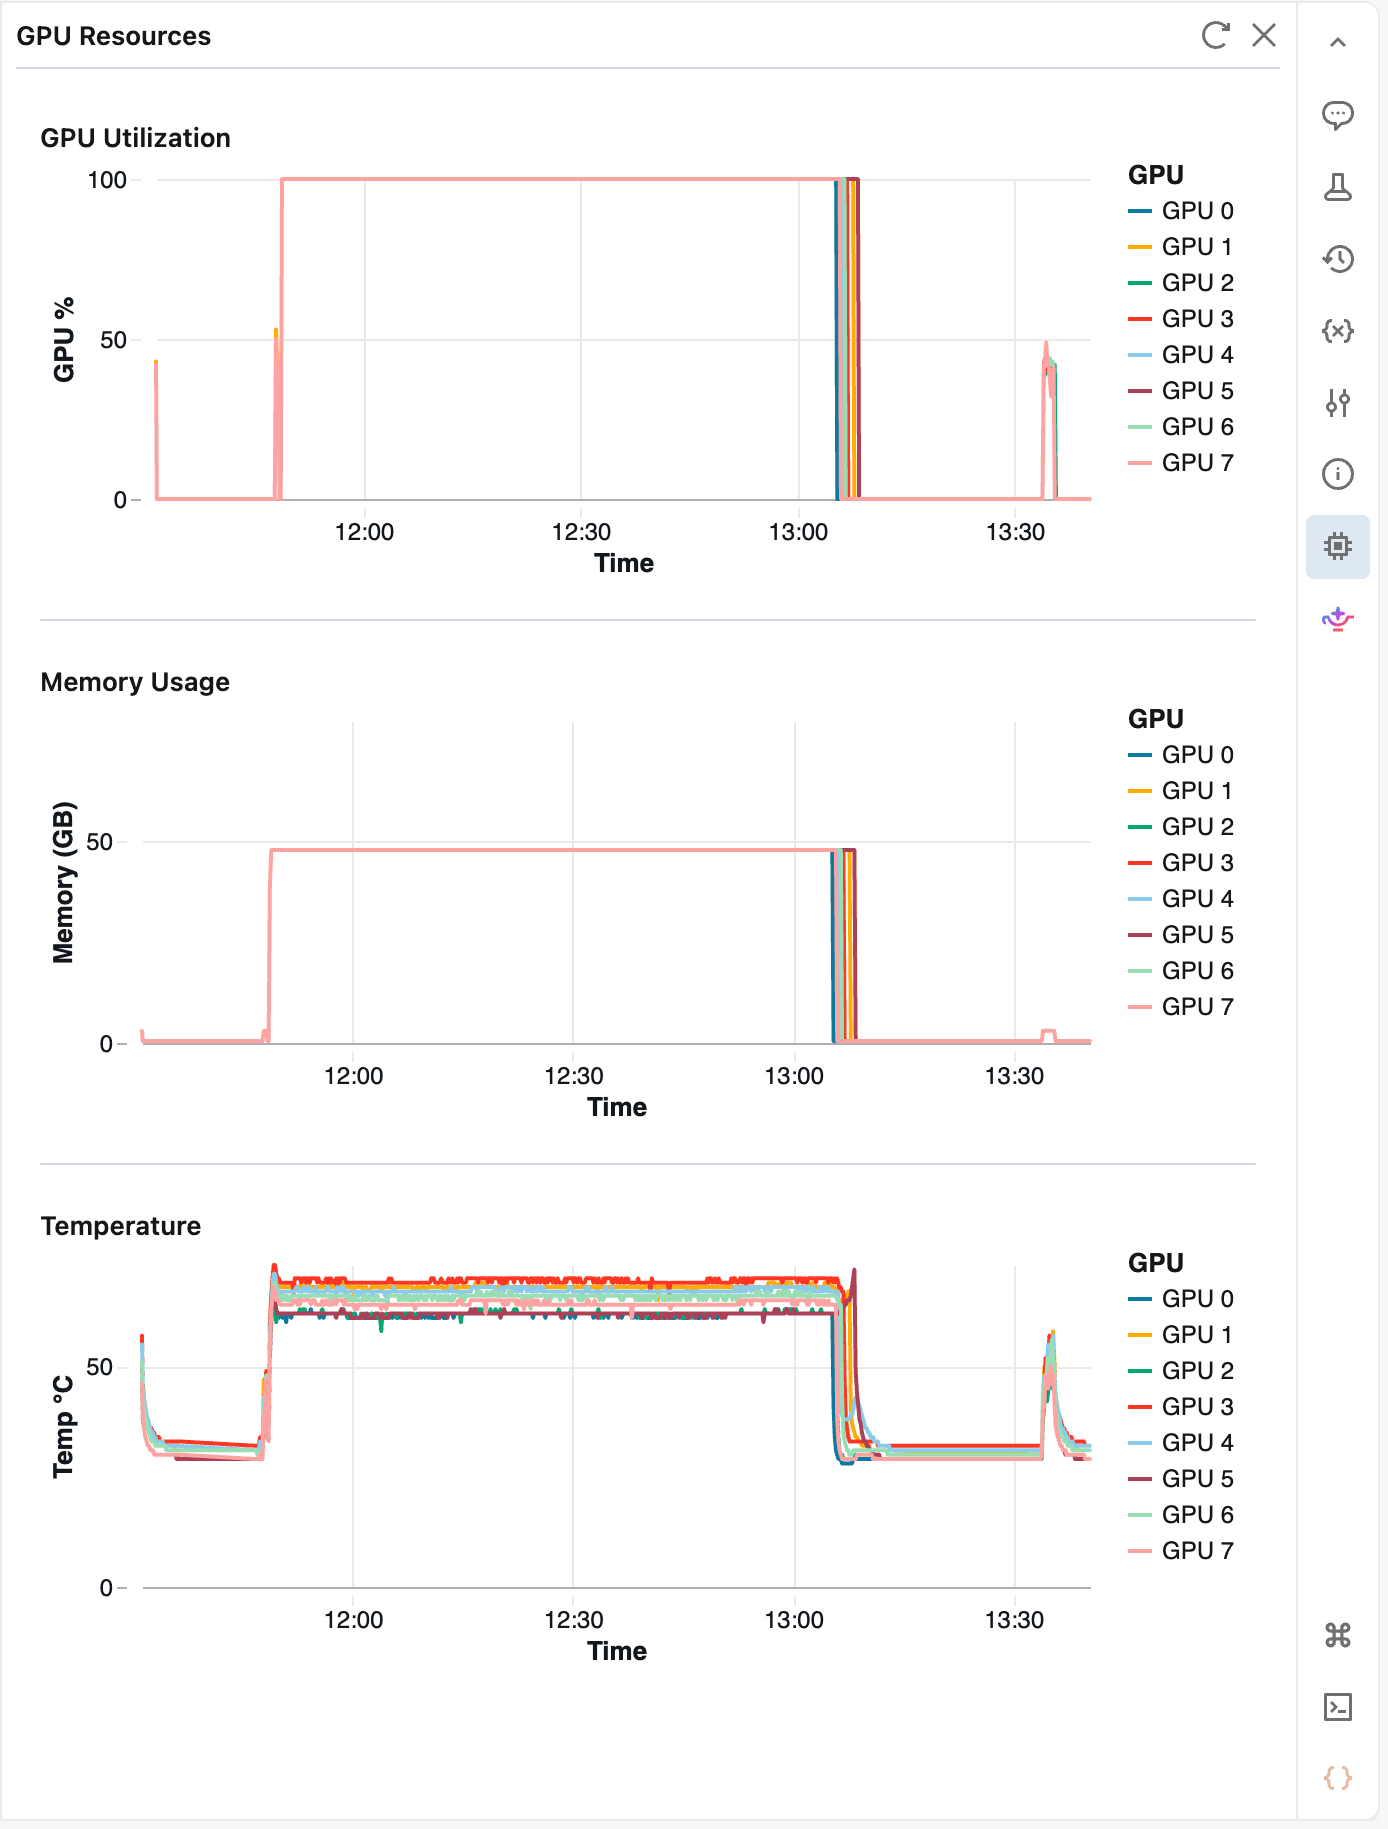
GPU metrics
If you are using CLI, you can utilize System Metrics to view GPU metrics.
5. Data Loading
Tabular Data:
Small Dataset: For small Delta tables, use Spark Connect to load the data. Then convert the Spark DataFrame to a pandas DataFrame with toPandas(). If needed, you can further convert it to a NumPy array using to_numpy(). This works well for Single Node
# Load Delta table

df = spark.read.format(”delta”).table(”your_catalog.your_schema.your_table”)

# Convert Spark DataFrame to pandas

pdf = df.toPandas()

# Optional: convert pandas DataFrame to NumPy array

arr = pdf.to_numpy()
Large dataset: For large Delta tables that are too big to convert with toPandas(), export the data to a Unity Catalog volume and load it directly using PyTorch or Hugging Face. This approach avoids Spark overhead during training and works well for both single-GPU and distributed training workflows.
# Step 1: Export the Delta table to Parquet files in a UC volume

output_path = “/Volumes/catalog/schema/my_volume/training_data”

spark.table(”catalog.schema.my_table”).write.mode(”overwrite”).parquet(output_path)

# Step 2: Load the exported data directly using Hugging Face datasets

from datasets import load_dataset

dataset = load_dataset(”parquet”, data_files=”/Volumes/catalog/schema/my_volume/training_data/*.parquet”)
Unstructured Data:
For unstructured data such as images, audio, and text files stored in Unity Catalog volumes, our recommendation is to use UCVolumeDataset from the serverless_gpu.data package.
UCVolumeDataset is a PyTorch IterableDataset that copies each file from the volume to a fast local cache on first access and yields the cached local file path. Besides local caching it supports automatic partitioning of files and divided across DataLoader workers, so each (rank, worker) pair receives a non-overlapping slice.
For optimal performance, pair UCVolumeDataset with serverless_gpu.data.DataLoader, rather than the stock PyTorch DataLoader, as it is tuned for serverless GPU I/O and fetches and caches files concurrently while the GPU computes.
from serverless_gpu.data import UCVolumeDataset

from torch.utils.data import IterableDataset

from PIL import Image

import torchvision.transforms.functional as TF

class ImageDataset(IterableDataset):

    “”“Decodes each cached file path from UCVolumeDataset into a tensor.”“”

    def __init__(self, path_dataset: UCVolumeDataset):

        self._path_dataset = path_dataset

    def __iter__(self):

        for local_path in self._path_dataset:

            image = Image.open(local_path).convert(”RGB”)

            yield TF.to_tensor(image)

path_dataset = UCVolumeDataset(”/Volumes/catalog/schema/my_volume/images”)

dataset = ImageDataset(path_dataset)
For more info about data loading, here is the doc.
Best Practices:
Load data inside the @distributed decorator: For distributed training, move data loading code inside the @distributed decorator. The dataset size can exceed the maximum size allowed by pickle, so it is recommended to generate the dataset inside the decorator.
from serverless_gpu import distributed

# This may cause a pickle error if the dataset is too large

dataset = get_dataset(file_path)

@distributed(gpus=8, gpu_type=’H100’)

def run_train():

   # Load data inside the decorator to avoid pickle serialization issues

   dataset = get_dataset(file_path)

   ...
When you build a UCVolumeDataset in the decorator, it uses torch.distributed rank info at runtime to automatically split files across ranks, so you don’t need a DistributedSampler for file-based volume data.
Use UCVolumeDataset for multi-epoch training so files are cached locally on first access and reused, instead of copying the entire volume upfront with shutil.copytree when you may only read part of it.
Cache data locally for multi-epoch training. For large datasets, copy datasets to /tmp for faster access across epochs:
import shutil
shutil.copytree(”/Volumes/catalog/schema/volume/dataset”, “/tmp/dataset”)
Parallelize data fetching: Use serverless_gpu.data.DataLoader to parallelize fetching. It’s a torch DataLoader subclass optimized for serverless GPUs, with higher defaults for worker count and prefetching so files are loaded and cached while the GPU runs. It also records per-batch load times in MLflow to help identify data bottlenecks.
from serverless_gpu.data import DataLoader

loader = DataLoader(

    dataset,

    batch_size=32,

    pin_memory=True,

    # num_workers=6, by default

    # prefetch_factor=4, by default

    # raise num_workers to increase parallel reads, or prefetch_factor to deepen each worker’s queue.

)
Adjust batch size: For large datasets, use a larger batch size so the cost of loading data per batch is spread over more samples, reducing file fetches each step. If GPU memory is tight, pair a larger batch with gradient accumulation to keep the same effective batch size.
Use Streaming datasets: For very large datasets that do not fit in memory, use streaming approaches.
UCVolumeDataset from serverless_gpu.data for streaming files from Unity Catalog volumes with local caching and automatic distributed partitioning.
PyTorch IterableDataset for custom streaming logic.
Hugging Face datasets with streaming for datasets hosted on the Hub or in volumes.
RayData for distributed batch data processing
FAQs
Q: My training run is slow and GPU utilization is low. What should I check first?
A: Start by inspecting the System Metrics tab in MLflow, focusing on GPU utilization, GPU memory usage, and data loading throughput. If GPU utilization is low while the GPU is not memory-bound, your data pipeline is likely the bottleneck. We recommend increasing your batch size or switching to serverless_gpu.data.DataLoader, which is specifically tuned for serverless I/O. Additionally, ensure you are using UCVolumeDataset to cache files locally instead of refetching them from Unity Catalog during every step.
Q: Should I use notebooks or the AIR CLI for my training workload?
A: It depends on your workflow phase. Use notebooks with the @distributed decorator for rapid prototyping and interactive debugging. Switch to the AIR CLI when you need production-grade features like version-controlled YAML configurations, multi-day training runs, or a CI/CD-style approach directly from your IDE.
Q: How do I resume a previous MLflow training run?
A: Set a custom run name using mlflow.start_run(run_name=”your-custom-name”) so you can identify the run later. To resume, call mlflow.start_run(run_id=”<previous-run-id>”) with the earlier run’s ID. This lets you continue logging metrics and artifacts into the same run record.
Q: Which environment should I choose — the base environment or the AI environment?
A: Start with the AI environment (recommended) as it has popular ML frameworks (PyTorch, DeepSpeed, vLLM, Ray, etc.) pre-installed. Use the base environment if you need full control over your dependencies and want a minimal setup. You can also use a base environment defined by your workspace admin, built on organization-standard images. Always pin library versions for reproducibility.
Thanks for reading. Feel free to share any feedback on topics you’d like to see next in the comments section.
Shout out to the AI Runtime PM, Tejas Sundaresan for helping us review the content in this blog.
We plan to work on Part 2 for this AI Runtime blog series next. In this post, we will share some more best practices around remote development options, cost and usage monitoring, and using genie code with AI Runtime. Stay tuned!