
Warming Up Databricks SQL Disk Cache for Reliable BI Dashboard Benchmarking
Warm up Databricks SQL for realistic performance tests


As a Specialist Solutions Architect at Databricks, I work with customers who want to compare Databricks SQL (DBSQL) performance against tools like Power BI, Tableau, and Databricks’ own AI/BI Dashboards. They’ll spin up a dashboard, hit “Refresh visuals,” time the result, and call that a benchmark.
Here’s the problem: production dashboards almost never run on a cold warehouse. Warehouses build up local disk cache as they serve repeated queries. If you benchmark against a cold cache, you’re not measuring what users actually see — you’re measuring the very first run after a restart.
This post introduces a production-friendly way to warm up the Databricks SQL disk cache using real historical queries. By replaying organic query patterns before testing, you can ensure your BI dashboards are benchmarked under realistic, steady-state conditions. The companion notebook provides all the code to automate this process and visualize when the cache has stabilized. You’ll be able to:
Prime a warehouse’s disk cache using realistic dashboard traffic
Keep benchmarks consistent across runs
Avoid cheating by using the result cache
Warm up one warehouse using the historical workload of a completely different warehouse
Why Benchmark with a Warm Cache
In production, BI dashboards rarely start from scratch. The Databricks SQL Disk Cache stores frequently accessed data locally on a warehouse cluster for faster retrieval. Ignoring this behavior during benchmarking can lead to unfair comparisons, especially if one test benefits from cached data while another does not.
A quick recap of caching layers in Databricks SQL:
Cold run — nothing is cached yet; all data is read from storage.
Warm run — data files are already cached on disk.
Result cache — identical query results are returned instantly if underlying data hasn’t changed.
If you want to measure what end users actually experience in Power BI, Tableau, or Databricks’ AI/BI Dashboards, in most cases, you must benchmark against a warm cache, not a cold run.
The Warm-Up Approach
The companion notebook automates the warm-up process by extracting historical SELECT queries from the system.query.history table and replaying them with controlled concurrency. This effectively “primes” the disk cache with the same data your dashboards typically access.
Each warm-up session can be customized with parameters such as:
Time range — which historical window of queries to extract
User or service principal — whose queries represent dashboard workloads
Warehouse ID — which warehouse’s query history to use as the source of truth
Concurrency and delay — to simulate natural workload intensity
The notebook also tracks total execution times across multiple warm-up iterations and visualizes convergence — helping you see when the cache has stabilized and is ready for reliable benchmarking.
Extracting Historical Queries
The notebook begins by pulling real queries from system.query.history. You specify a user, warehouse, and time range that represents your normal dashboard activity:
query = f”“”
  SELECT statement_text
  FROM system.query.history
  WHERE start_time >= ‘{start_time_utc.isoformat()}’
    AND start_time <= ‘{end_time_utc.isoformat()}’
    AND executed_by = ‘{EXECUTED_BY}’
    AND compute.warehouse_id = ‘{WAREHOUSE_ID}’
  ORDER BY start_time
“”“
This ensures that the warm-up process reflects genuine production workloads, not synthetic benchmarks.
Avoiding Result Cache Shortcuts
If you replay the same queries exactly, Databricks SQL will return them from the result cache — defeating the purpose of warming the disk cache. To avoid that, the notebook automatically injects a harmless dynamic column into each query:
SELECT col_a, col_b, NOW() AS injected_now
FROM sales.fact_orders
WHERE ...
This simple trick forces each query to execute freshly while preserving the same scan patterns, ensuring that the disk cache — not the result cache — is exercised.
Alternatively, if you prefer not to modify queries programmatically, you can disable the result cache for the session before replaying queries:
SET use_cached_result = false;This directive ensures that all queries execute freshly, regardless of whether identical results exist in the cache. For more details, see the Databricks documentation on query caching.
Replaying Queries with Concurrency
The modified queries are then replayed concurrently using the Databricks SQL Connector for Python. This concurrency simulates the burst of queries typical of a dashboard refresh:
from databricks import sql
import concurrent.futures, time

def execute_query(q):
    conn = sql.connect(**DBSQL_CONFIG)
    cursor = conn.cursor()
    cursor.execute(q)
    cursor.fetchall()
    cursor.close()
    conn.close()

def run_warmup(queries, passes, concurrency, delay_sec):
    durations = []
    for i in range(passes):
        start = time.time()
        with concurrent.futures.ThreadPoolExecutor(max_workers=concurrency) as pool:
            pool.map(execute_query, queries)
        durations.append(round(time.time() - start, 2))
        time.sleep(delay_sec)
    return durations
In practice, you don’t need extreme concurrency to warm a single DBSQL warehouse. For most standard setups, 10 concurrent queries are sufficient to engage the warehouse’s local cache efficiently without overwhelming it. However, if you’re using multiple clusters per warehouse (for example, auto-scaled DBSQL configurations), you should scale concurrency proportionally — roughly 10 × N, where N is the number of clusters. This ensures that all clusters participate in the warm-up process and that data is cached across all of them.
Visualizing Cache Stabilization
After replay, the notebook visualizes warm-up durations across multiple passes to confirm that the cache has reached steady state:
import matplotlib.pyplot as plt

plt.figure(figsize=(8, 5))
plt.bar(range(1, len(durations)+1), durations)
plt.title(”Execution Time per Warm-up Pass”)
plt.xlabel(”Pass”)
plt.ylabel(”Duration (seconds)”)
plt.grid(axis=’y’)
plt.tight_layout()
plt.show()
You should see total duration drop sharply after the first run and then level off. When the bars flatten, the warehouse’s disk cache is effectively warmed, and your benchmark can begin.
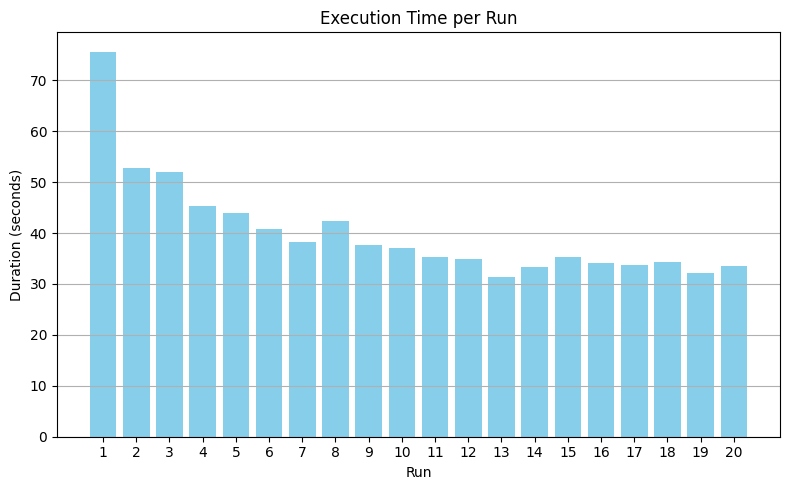
The chart shows total warm-up duration across repeated passes for an X-Large DBSQL warehouse configured with 2 clusters (min = 2, max = 2). The first run is the slowest (cold cache). After several passes, execution time flattens — indicating the warehouse’s disk cache has converged and is ready for benchmarking.
Using Separate Warehouses for Query Extraction and Warm-Up
A powerful capability of this approach is that you can separate where you extract history from where you warm up.
This helps keep production environments safe and ensures that your benchmarks are isolated.
Extraction warehouse: Connect to any SQL warehouse with access to
system.query.historyand filter for the production warehouse whose workload you want to reproduce. This step is lightweight and metadata-only.Warm-up warehouse: Use a different SQL warehouse (for example, a staging or benchmarking environment) to replay those queries and populate its disk cache.
This separation allows you to safely warm up a benchmarking warehouse using production-like workloads, without affecting your production dashboards or incurring additional load.
Why This Matters for BI Dashboards
Whether your users interact through Power BI, Tableau, or Databricks’ native AI/BI Dashboards, they all benefit from a warm disk cache. By simulating steady-state conditions before running benchmarks, you can:
Ensure consistent, realistic performance testing
Evaluate dashboard changes fairly
Tune warehouse size and concurrency
Compare tools and configurations on equal footing
Conclusion
To measure true user experience, always benchmark against a warmed Databricks SQL disk cache — not a cold one.
Extract real queries from
system.query.historyModify them to bypass the result cache
Replay them with realistic concurrency (≈10 per cluster)
Confirm warm-up stabilization
Then test your dashboards
The companion notebook automates this entire workflow — including query extraction, replay, visualization, and optional warehouse separation — so you can focus on measuring performance, not preparing for it.