


TL;DR
Most production agent failures come from three architectural decisions: data serving path, data access abstraction, and observability.
Start with the simplest serving path that meets latency needs: use SQL Warehouse first, optimize table layout and queries, then add session caching or OLTP only if measurements justify it.
Put all data access behind one execution interface like
execute_sql(...)so you can centralize routing, caching, retries, parameterization, and safety controls.Treat observability as a launch requirement: trace tool calls, store traces in queryable tables, and add a synthetic heartbeat to measure true end-to-end freshness and latency.
The winning pattern is not “most advanced architecture first”; it is measure, optimize the hot path, and preserve the ability to swap components without rewriting the agent.
The Framework
You can stand up an agent in an afternoon. Standing one that holds latency SLAs under real concurrency is a different exercise — one most teams underestimate.
The good news: most production agents need to talk to data and they will eventually run into the same three forks in the road. Pick well on each, and most of the other problems become tractable. Pick poorly, and you’ll be rebuilding under pressure.
This is a practitioner’s framework for the three decisions. They’re independent — you can tackle them in any order, and most teams end up working on all three in parallel. What matters is that you’ve made a deliberate call on each one.
Decision 1: How will the agent fetch data?
The instinct here is to jump to the most complex serving pattern before tuning the simplest one. Resist it.
You have three realistic options:
Option A — Direct SQL Warehouse Serverless. Your tool calls go straight to a SQL warehouse. No new infrastructure, no reverse ETL. Worth knowing: Serverless keeps a remote result cache that survives warehouse shutdowns, so repeat queries stay fast even after the warehouse scales to zero. The fastest thing to ship.
Option B — In-session caching. If your agent makes repeated queries against the same dataset within a single session, fetch it once and cache it in the session so subsequent calls don’t re-hit the warehouse. The implementation can be as simple as a dict or a DataFrame in the agent process, or an embedded SQL engine like DuckDB if you need to issue varied SQL against the cached data. The decision is about recognizing intra-session repetition, not about picking a cache library.
Option C — Lakebase (OLTP). You reverse-ETL the tables the agent reads into Databricks Lakebase, a managed Postgres, and the agent queries Postgres instead of Delta. Sub-50ms point lookups. Highest performance ceiling, highest operational cost. Lakebase also doubles as a place to store online features for sub-second feature lookups and can persist agent session state — if you’re already running it for those reasons, the marginal cost of using it as your serving layer drops.
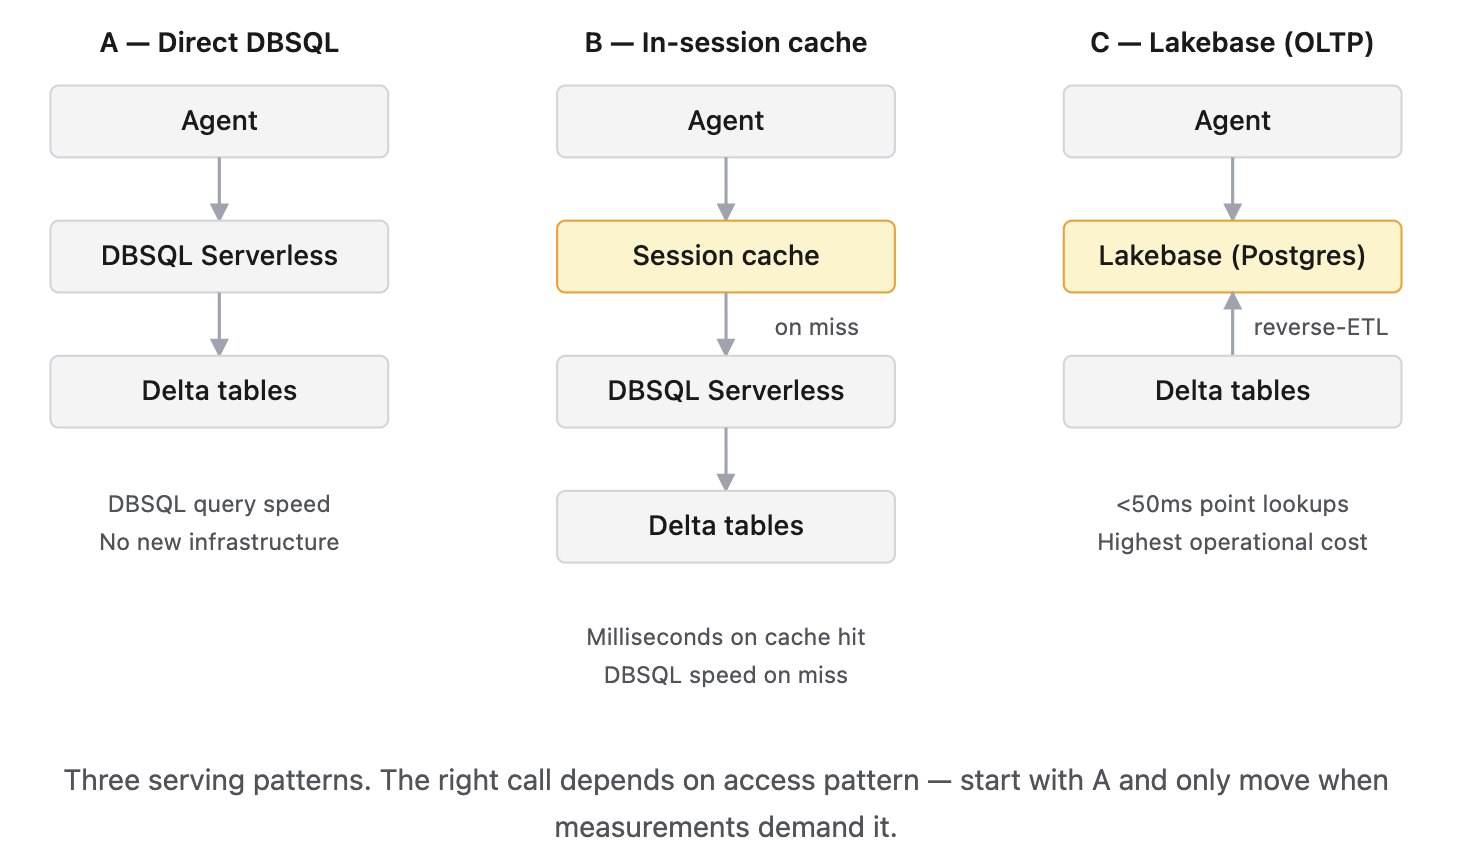
The mistake I see most: teams pattern-match on “we need low latency” and jump to Option C before they’ve measured Option A. They end up running a reverse-ETL pipeline they didn’t need.
Here’s the order that actually works:
Start with Option A. Get the agent end-to-end on SQL Warehouse/ DBSQL Serverless. Size the warehouse sensibly — Medium for dev, Large for prod is a reasonable starting point — X-Large gets expensive fast and is rarely the right place to begin. Start with min 1, max 3–4 clusters, then watch the query history; if queries are getting queued, add a cluster. Keep the warehouse warm if you can’t tolerate cold-start tail latency on the first query after a scale-down.
Tune the simple path before adding a complex one. Did you actually optimize the layout of the table the agent reads? Are your queries hitting the right clustering keys? Are you using native parameterized queries, not inline params? In our experience, half of the “we need OLTP” cases evaporate once the table layout is right.
Only then evaluate B or C. The decision turns on access pattern, not vibes. If a single session issues several tool calls that hit the same underlying data, Option B’s in-session caching pays for itself — the trigger is repetition within a session, not session length. If your agent makes single point lookups with hard sub-second SLAs across thousands of concurrent sessions, Option C is the answer.
A note on what actually matters for performance: it’s the engine serving the agent and the layout of the specific table that engine reads — nothing else. Medallion labels are organizational naming, not architecture. The agent doesn’t care what tier a table sits in; it cares whether the table it queries is laid out for fast reads. If your agent reads from a Delta table via SQL Warehouse/DBSQL, that table’s clustering and file layout determine your latency. If your agent reads from Lakebase, the Delta layout upstream is mostly irrelevant; what matters is the Postgres indexing and the sync freshness. Either way: optimize whatever the serving engine actually reads at query time, and let Predictive Optimization handle upstream tables that aren’t in the agent’s hot path. Avoid materialized views with non-deterministic refresh behavior anywhere in that hot path.
For Delta tables specifically, use liquid clustering and put real thought into the clustering keys. Sortable types make great keys — integers, dates, and timestamps in particular, because they have clean min/max statistics that let Delta skip files efficiently. String keys can work, but they’re far more sensitive to encoding choices (lexicographic ordering, padding, casing) and tend to underperform. Pick keys that match the actual filter patterns the agent will hit — usually some tenant or entity ID plus a time dimension — and verify the agent’s queries are pruning files the way you expect by reading the query profile.
Quick tip: If you’re merging into a table continuously — say every 5 seconds — schedule explicit liquid clustering at a regular cadence (every 30–60 minutes). Otherwise you’re relying on Predictive Optimization to catch up on its own schedule, and for hot, agent-facing tables that’s usually not fast enough.
Force yourself to write down, before you build:
The p95 latency budget per agent tool call, end-to-end, not per-query.
Average and p90 queries per agent session. If it’s two, the cache barely helps. If it’s ten, it’s a no-brainer.
The size of the largest object the agent will scan. Some OLTP stores have hard per-instance ceilings; if you’re past them, the architecture has to bend.
Decision 2: How will you expose data to the agent?
Some tool in your agent that needs data —they needs a way to talk to the data plane. The instinct is to give each tool its own SQL connector when needed, its own connection management, its own retry logic. Don’t.
Use one execution interface. A single function — call it execute_sql(query, max_staleness:int = 60) — that every data-bearing tool calls. Routing, caching, parameterization, observability, retries: all internal to that one function. Tools pass SQL, get results back, and don’t know or care whether the query went to SQL Warehouse, an in-memory cache, or Lakebase.
Without abstraction each tool manages its own connector, retries, parameters. With execute_sql One place to route, optimize, and enforce safety. Without the abstraction, every tool reinvents connection management. With it, you change one function to swap engines, tune queries, or harden security.
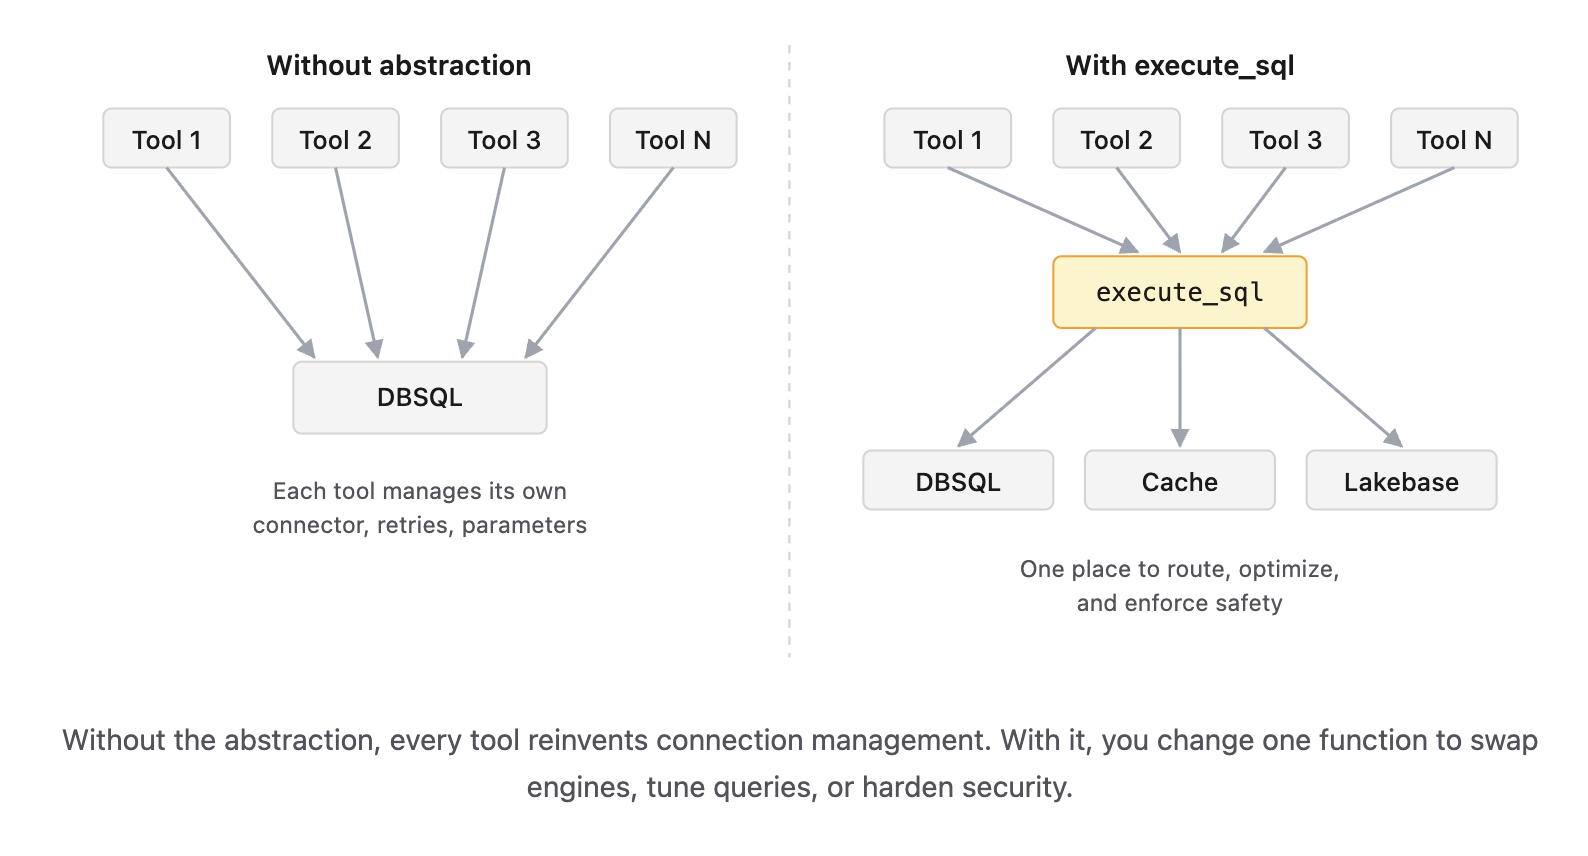
This is the single highest-leverage abstraction you can put in your agent. Three reasons:
One place to optimize. Tuning one query path improves every tool simultaneously. Tuning nine separate paths means you’ll tune three and forget the rest.
One place to swap implementations. When you decide to add caching (Decision 1, Option B) or move to Lakebase (Option C), no tool code changes. You rewrite execute_sql and you’re done.
One place to enforce safety. Parameterization, query limits, allowed-table lists — all enforced once.
On safety specifically, two things to bake in from day one.
Native parameterized queries, always. If you’re on databricks-sql-connector >= 3.0, use paramstyle=”named”. Inline parameters bypass server-side caching, won’t survive a future connector release, and open up injection vectors.
Keep sensitive identifiers out of the model’s parameter space. If your agent operates on a specific tenant, customer, or dataset, the model should not be the thing choosing which tenant to query. Use a factory/closure pattern: bind the tenant ID into the tool at construction time, so the model can only call the tool — it can’t substitute a different tenant via prompt injection. Save the parameterized version for arguments the model genuinely should control, like a column name to inspect.
def make_detect_missing_data(tenant_id: str):
    @tool
    def detect_missing_data(column_name: str) -> str:
        """Detect null values in a column."""
        return _run(tenant_id, column_name)  # tenant_id closed over
    return detect_missing_data
Compare that to the naive pattern where tenant_id is a tool parameter the LLM fills in. The naive version is one cleverly-worded user message away from a tenant-isolation incident.
Let the caller declare freshness tolerance. execute_sql should accept a max_staleness parameter — the maximum age of cached data the caller will tolerate for this query. If max_staleness is generous (say, 60 seconds), the query runner is free to serve from the in-session cache, the SQL Warehouse remote result cache, or a Lakebase replica with known lag. If it’s zero, the runner bypasses caches and goes to the source of truth. This pushes the consistency-vs-latency tradeoff to the call site, where the tool author actually knows whether eventual consistency is acceptable. Without it, you end up either over-caching (and serving stale answers in places that can’t tolerate them) or under-caching (and paying full warehouse latency for queries that didn’t need fresh data).
Decision 3: How will you know the agent is working?
If you can’t see what your agent is doing in production, you don’t have an agent — you have a black box that occasionally answers questions. Most teams get tracing late, after the first incident. Don’t be that team.
Use MLflow tracing, and route it to Unity Catalog. MLflow’s tracing is OpenTelemetry-compatible. Link your experiment to a Unity Catalog trace location with
syntax trace_location=UnityCatalog(
catalog_name=catalog_name,
schema_name=schema_name,
table_prefix=table_prefix)
and your traces land as Delta tables in UC that you can query with SQL. You’ll thank yourself the first time someone asks “show me every slow trace for tenant X in the last 24 hours.” Without UC-backed traces, that’s an afternoon of grepping logs. With them, it’s a SQL query.
Instrument the right boundaries. At minimum: input validation, tool dispatch, each tool’s SQL execution, and the model call itself. If your agent framework supports autolog, lean on it — but verify it’s actually emitting the spans you expect. Auto-instrumentation has bugs and gets disabled by version mismatches. When autolog isn’t trustworthy in your stack, fall back to manual mlflow.start_span() for the boundaries that matter. Don’t trace everything; trace the things you’d want to filter on during an incident — tenant_id, query_pattern, tool_name.
Add a synthetic heartbeat. Inject a known record at the source on a fixed cadence — every 30 or 60 seconds — and measure when it shows up at the agent. This is the one honest measure of end-to-end latency. System tables and per-stage metrics will tell you each component is healthy while the whole pipeline is silently 90 seconds behind. A heartbeat catches that immediately. It’s about a hundred lines of code; build it before you scale.
Set a latency budget per stage and defend it. Source → ingestion → transformation → serving table → agent. Every stage gets a number. Every stage has an SLO. When something breaks, you know which stage to look at without guessing. The budget also forces an honest design conversation: if your end-to-end target is 30 seconds and CDC alone takes 12, you don’t have 18 seconds for everything else — you have to decide what to cut.
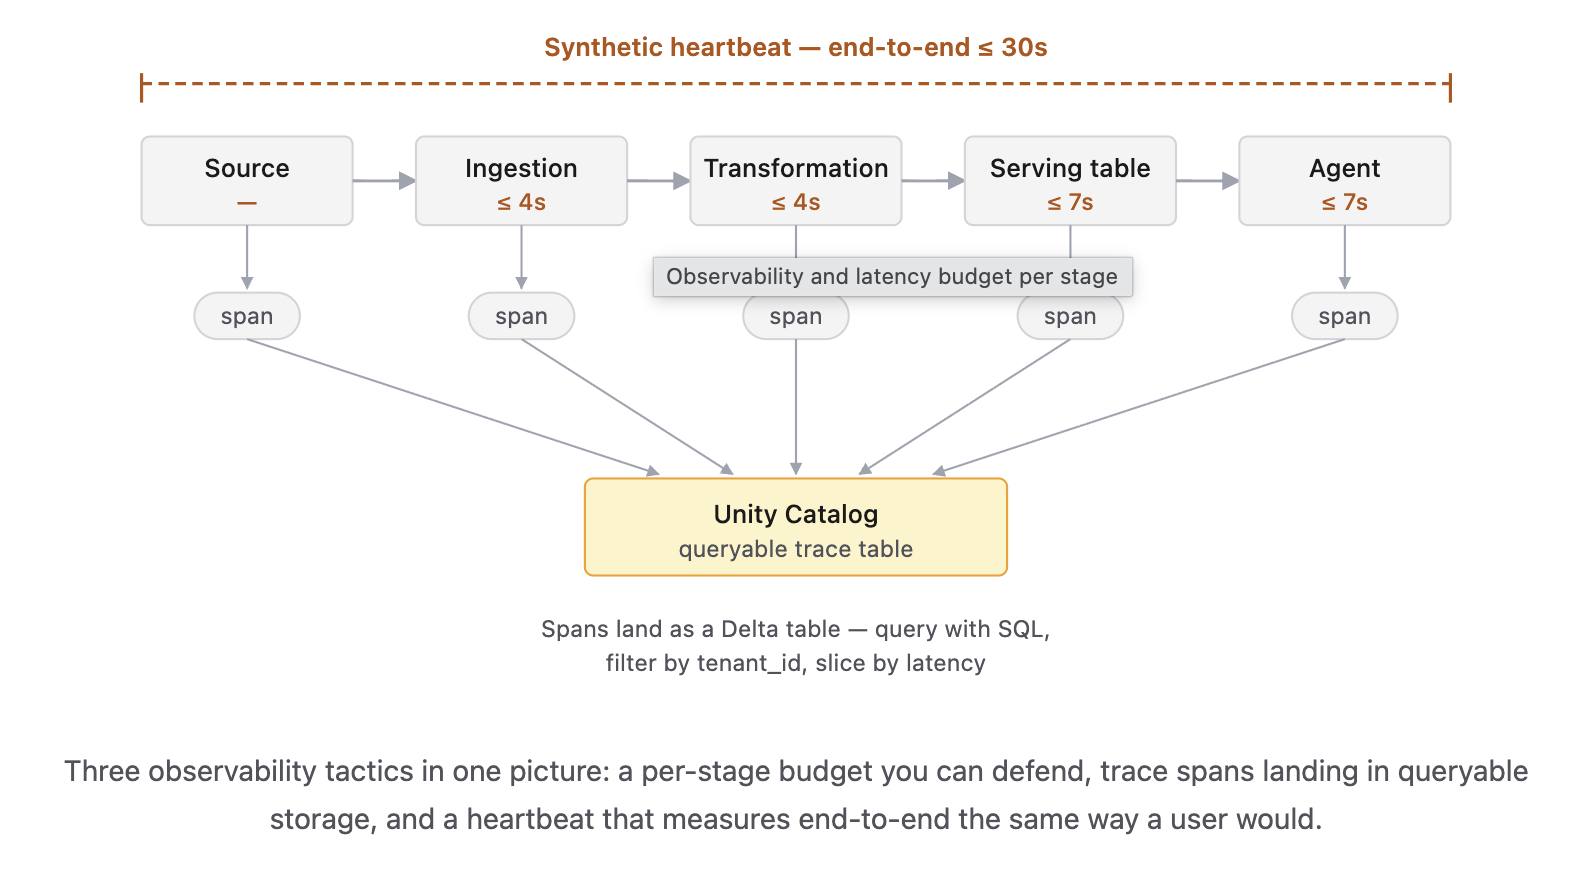
Three observability tactics in one picture: a per-stage budget you can defend, trace spans landing in queryable storage, and a heartbeat that measures end-to-end the same way a user would.
What this looks like in practice
Start simple. Ship Option A for serving. Wrap data access in execute_sql. Turn on MLflow tracing to Unity Catalog and add a heartbeat. Resist the urge to add caching, OLTP, or stateful streaming gymnastics until you’ve measured a real problem.
The teams that ship reliable agents they do it boringly. They benchmark before they scale. They write down their latency budget. They abstract their data access. They trace the things that matter.
The teams that ship unreliable agents skip ahead to the interesting parts and find out, in production, that the boring parts were the load-bearing parts.
You don’t need to pick the optimal architecture on day one. You need to pick one you can swap pieces of without rewriting everything. Get the three decisions above right and you will thank yourself later.
FAQ
1. What is the best default serving option for a new production agent?
Start with SQL Warehouse. It is the fastest path to production, requires the least new infrastructure, and is often sufficient once query patterns and table layout are optimized.
2. When should I add in-session caching?
Add it when a single agent session repeatedly queries the same underlying data. If sessions only issue one or two reads, caching usually adds complexity without much benefit.
3. When does an OLTP serving layer make sense?
Use it when you need very fast point lookups under high concurrency and have hard latency targets that the warehouse path cannot meet even after optimization.
4. Why should every tool call the same execute_sql(...) function?
A shared execution layer gives you one place to manage routing, retries, caching, parameterization, observability, and safety policies. It also makes future architecture changes much easier.
5. What is the biggest security mistake in agent data access?
Letting the model choose sensitive identifiers such as tenant or customer IDs. Those should be bound into the tool outside the model’s control to reduce isolation and prompt-injection risk.
6. What should I instrument first?
At minimum, trace input validation, tool dispatch, SQL execution, and model calls. Then add a synthetic heartbeat so you can measure actual end-to-end lag, not just component-level health.
FYI, this article was written before Lakehouse RT was released. Please consider Lakehouse RT for agent-facing queries where, you need sub-second performance . https://www.databricks.com/blog/introducing-lakehousert-real-time-performance-unified-lakehouse