
Reclaim Spend from Idle Databricks Apps
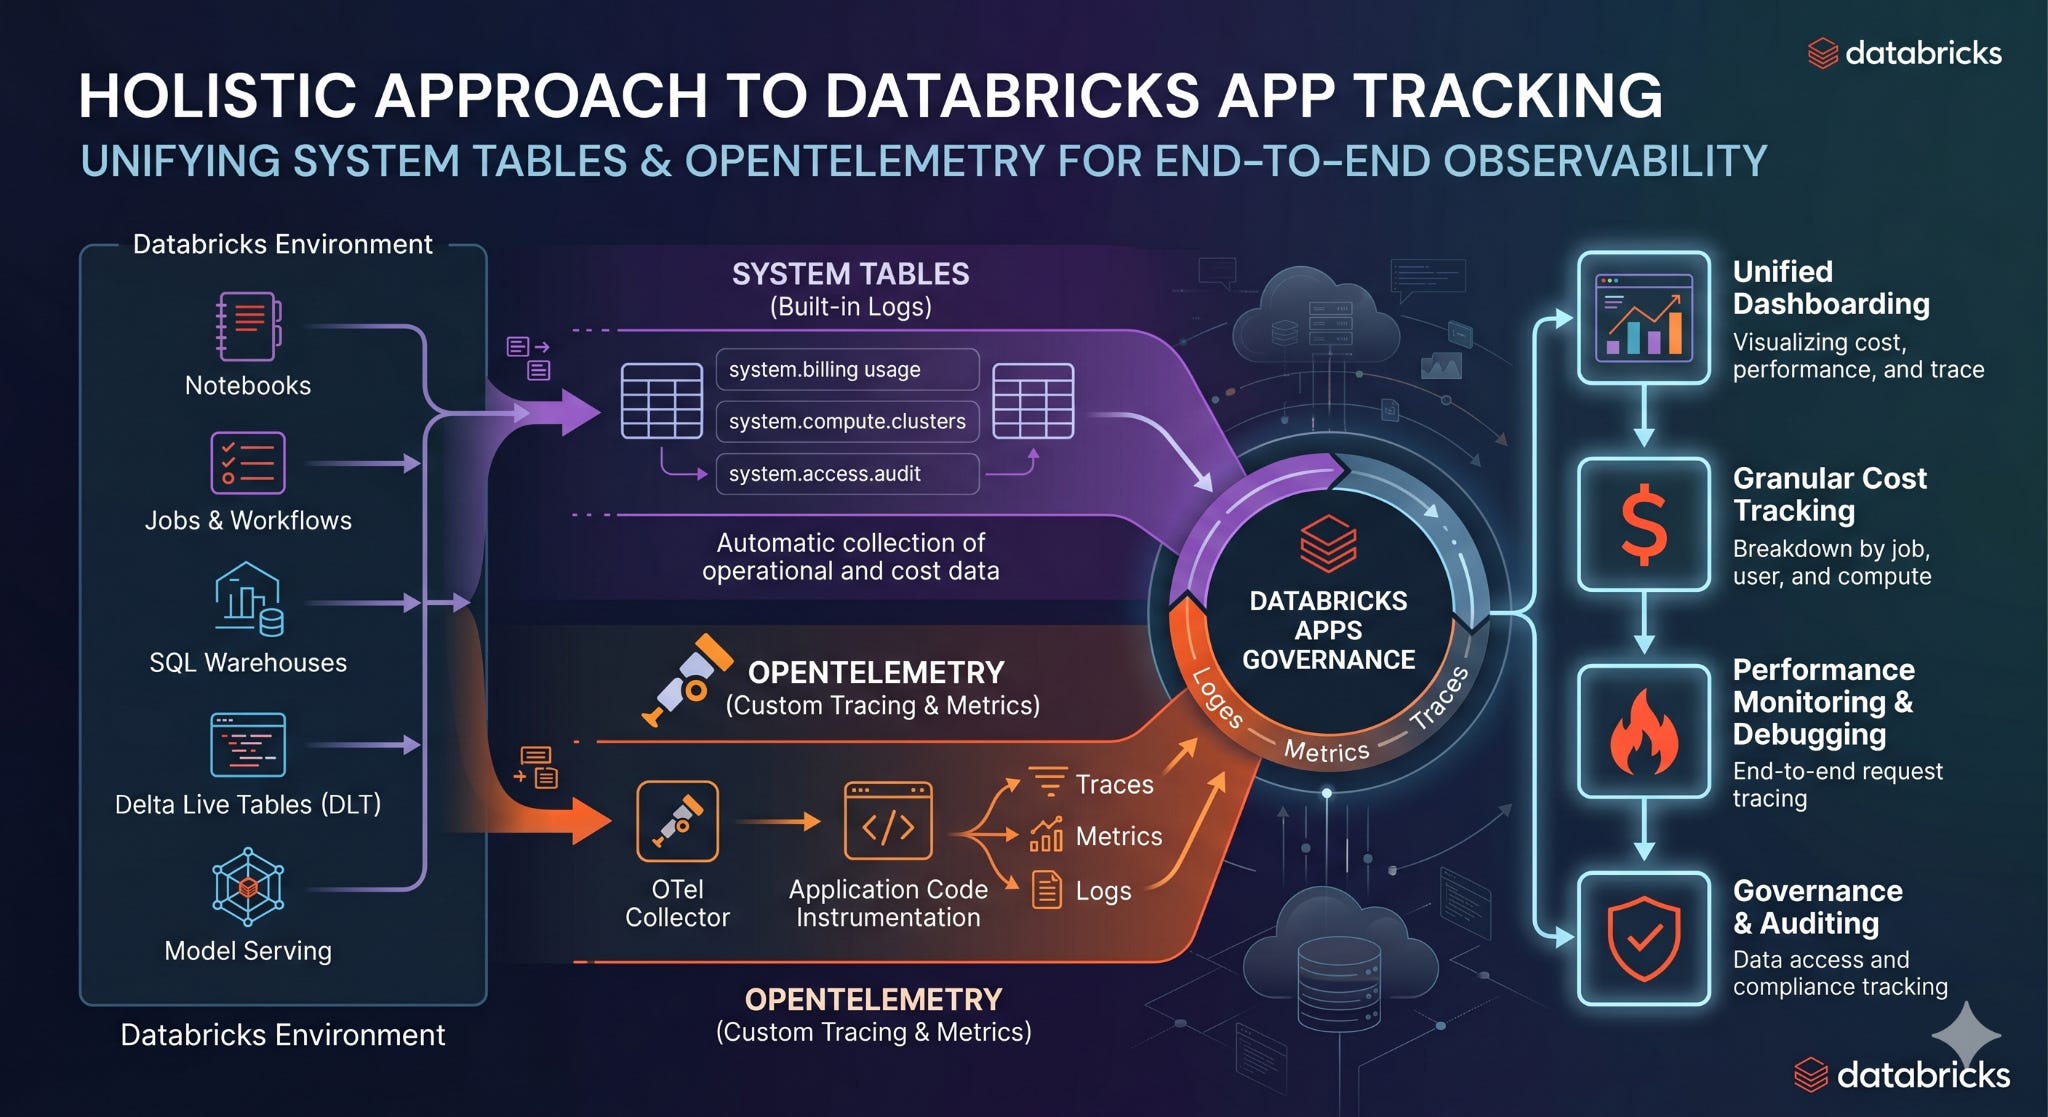
A daily governance workflow combining System Tables and OpenTelemetry

TL;DR: A workflow that finds and stops idle apps
Databricks Apps adoption can outpace the visibility into what’s running, who owns each app, and what it’s costing. A workspace can quickly accumulate hundreds of apps across business teams - some delivering ongoing value, many running 24/7 long after anyone last touched them, with the compute bill climbing alongside.
Effective app management requires two complementary signals:
System tables : for inventory, ownership, lifecycle events, and cost attribution
OpenTelemetry export to Unity Catalog : for request-level usage and idle detection [At the time this blog was published, App telemetry is in Public Preview.]
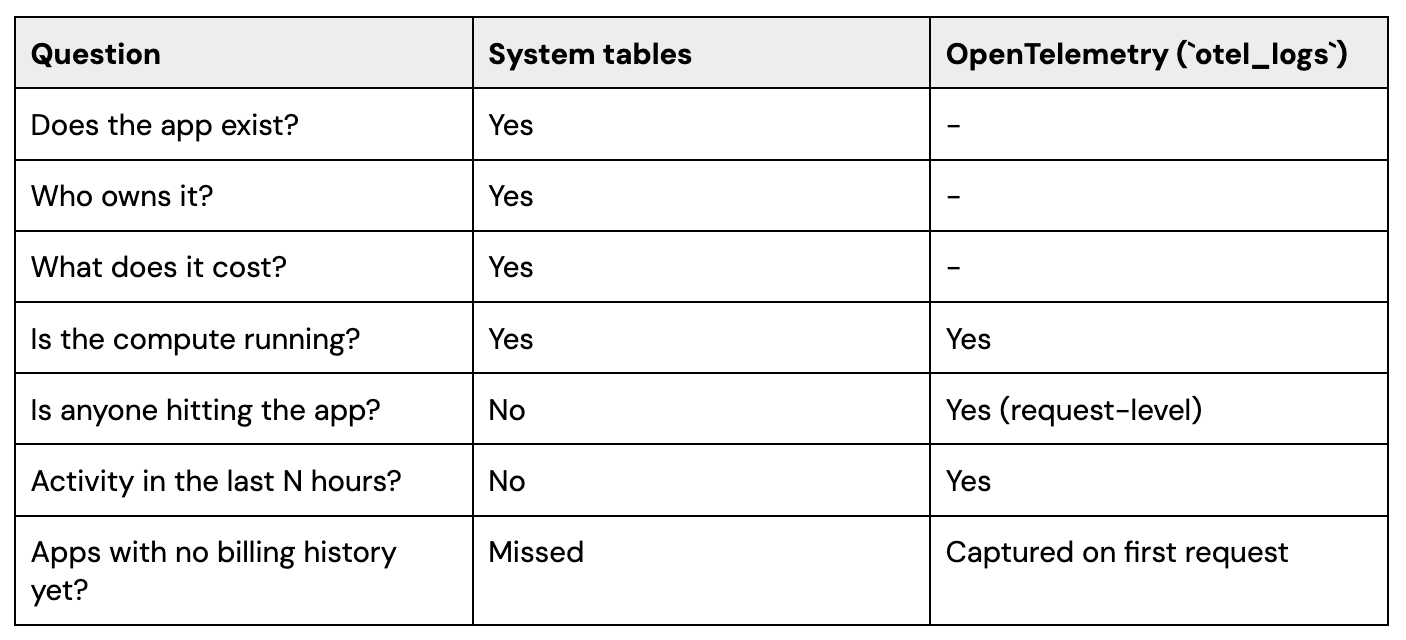
Used together, these answer the full set of questions a platform team needs: what do we have, who owns it, what does it cost, and is anyone using it? This post walks through both layers and shows how to combine them into a daily workflow that includes automated idle-app shutdown.
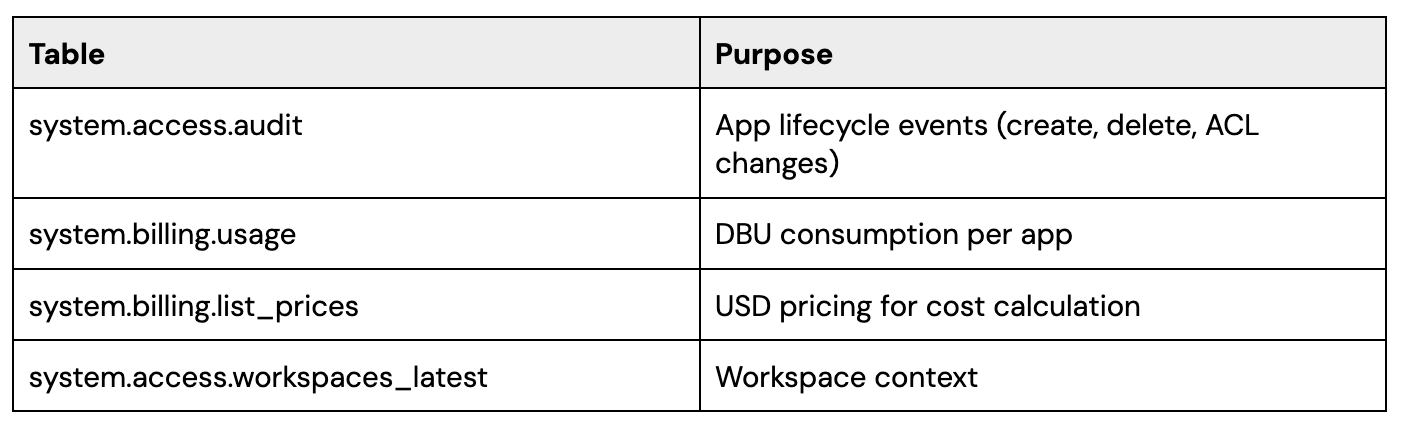
Pillar 1: Governance and Cost Attribution with System Tables
System tables provide the foundation for Apps governance. Four tables, combined, answer most operational questions:
Questions this layer answers
System tables provide the core signals needed to understand the operational footprint of Databricks Apps across a workspace:
Ownership : Creation events help identify the original app owner, while ACL change events help surface who currently has management access.
Cost : Usage data from system.billing.usage, combined with pricing data from system.billing.list_prices, makes it possible to estimate app cost over time.
Orphaned Apps: Apps with no apparent current manager can be flagged for review as potentially orphaned.
Deletion history : Delete events provide a historical view of app removals, including timing and actor.
Recreate cycles: Creation and deletion history can reveal create → delete → recreate patterns that may indicate experimentation, churn, or unstable ownership.
System tables answer what do we have and what does it cost. The next dimension - is anyone actually using it - requires a usage signal.
Pillar 2: Usage Signals with OpenTelemetry
Databricks Apps support native OpenTelemetry export to Unity Catalog. Three telemetry tables can be configured for an app, but they differ in what is required to populate them:
otel_logs - request logs and platform-emitted auth events. Populated automatically once OTel export is configured and the app is redeployed. No code changes required.
otel_metrics - request counts, latencies, and other application-level metrics. Only populated after custom instrumentation is added to the app code (e.g. using the OpenTelemetry SDK in the application).
otel_spans - distributed traces. Only populated after custom instrumentation is added to the app code.
For governance use cases - and idle detection in particular - otel_logs is the primary signal, and the one that works out of the box. Each request lands in otel_logs with an app.name attribute and timestamp, providing per-request activity data that is independent of compute state.
If teams add custom instrumentation later, otel_metrics and otel_spans open up deeper analysis (latency SLOs, error budgets, user journey traces), but they are not required for the workflow described in this post.
Enabling OTel export on an app
Enablement is a single asynchronous update call per app, using the :createUpdate endpoint with an explicit update_mask.
‼️Do not use the direct PATCH /api/2.0/apps/{name} endpoint for this purpose because it performs a full replacement of the app object, which will silently wipe resources, env_vars, and permission attachments when those fields aren’t included in the request body. :createUpdate with update_mask: “telemetry_export_destinations” ensures only that field is modified.
def patch_telemetry(app_name):
   """Enables OpenTelemetry export to Unity Catalog for the specified Databricks App."""
   payload = {
       "app": {
           "telemetry_export_destinations": [
               {"unity_catalog": TELEMETRY_TABLES}
           ]
       },
       "update_mask": "telemetry_export_destinations"
   }
   return requests.post(
       f"{workspace_url}/api/2.0/apps/{app_name}:createUpdate",
       headers=headers,
       json=payload,
   )
Looping this over GET /api/2.0/apps lets you enable telemetry across the full app fleet. After each app is redeployed, otel_logs begins populating automatically once the app receives traffic, while otel_metrics and otel_spans remain empty until the application code is instrumented.
What OTel adds beyond billing data
Both layers are needed for confident operational decisions. An app may be running and accruing DBUs while no user has touched it for weeks.
🚨 Caveats and Operational Considerations with OTel
Cold-start gap after OTel enablement. The workflow trusts otel_logs to mean ‘this app had no requests in the activity window.’ If OTel export was just enabled, no telemetry has had time to accumulate - every app looks idle, and a first-day run will flag every app for shutdown. Don’t act on the workflow’s recommendations until telemetry has been collecting for at least as long as your idle-detection window.
PII in telemetry. OTel auto-instrumentation captures request URLs, query parameters, headers, and request bodies. If apps pass user data through URLs, it will land in otel_logs. Apply row-level security on telemetry tables from day one.
Staggered enablement and redeployment. Patching telemetry config and redeploying causes a user-visible app restart. For workspaces with hundreds of apps, schedule the enablement in off-hours batches and stage tier-1 apps separately to minimize disruption.
Explicit protection for critical apps. Maintain a PROTECTED_APPS list in the shutdown job. Incident-response tools, on-call dashboards, and tier-1 business apps should be hard-coded as exempt regardless of activity level.
Telemetry table retention.otel_logs grows quickly at scale. Set retention windows and VACUUM schedules on day one, partition by date, and monitor storage cost. Otherwise, telemetry storage will offset the savings from idle-app shutdown.
Governance using System Tables and OTel
With both System tables and OTel metrics in place, identifying and stopping idle apps becomes a 5-step workflow.
Idle Detection and Shutdown in 5 simple steps
Step 1: Find apps with recent activity
Query the OpenTelemetry logs for any app that has had user requests or auth events in the activity window. A 7-day window is a safe production default; tighten only after observing baseline traffic patterns.
WITH activity AS (
SELECT DISTINCT
  COALESCE(
    service_name,
    variant_get(resource.attributes, '$["app.name"]', 'STRING')
  ) AS app_name
FROM my_catalog.my_schema.otel_logs
WHERE `time` >= current_timestamp() - INTERVAL 7 DAYS
)
SELECT app_name FROM activity WHERE app_name IS NOT NULL
Step 2: Compute idle candidates
Combine the activity set with the live app inventory (GET /api/2.0/apps) and apply three safety filters: only ACTIVE apps are candidates, anything in PROTECTED_APPS is exempt regardless of activity, and any app younger than MIN_AGE_DAYS is skipped so newly-deployed apps have room to ramp.
from datetime import datetime, timezone
from dateutil.parser import parse as parse_ts

PROTECTED_APPS = {
    "oncall-dashboard",
    "incident-router",
    "exec-monitoring",
}
MIN_AGE_DAYS = 7   # grace period for newly-deployed apps

active = {
    row["app_name"]
    for row in spark.sql("<Step 1 SQL>").collect()
}

candidates = []
for app in list_all_apps():
    state = (app.get("compute_status") or {}).get("state")
    age_days = (datetime.now(tz=timezone.utc) - parse_ts(app["create_time"])).days
    if (
        state == "ACTIVE"
        and app["name"] not in active
        and app["name"] not in PROTECTED_APPS
        and age_days >= MIN_AGE_DAYS
    ):
        candidates.append(app["name"])
Step 3: Resolve owners and notify
This step combines both pillars: query system.access.audit (Pillar 1) to derive a per-app ownership table, then resolve owners for the candidate set generated from OpenTelemetry logs (Pillar 2), and send a 7-day warning to each candidate’s owner. The notification mechanism is intentionally a placeholder - Slack, email, or a Databricks Apps inbox notification all work. The audit trail produced in Step 4 is what matters.
# Build the per-app ownership table from System table system.access.audit.
# Run this once during setup; refresh weekly via a separate job.

spark.sql("""
  CREATE OR REPLACE TABLE apps_ownership AS
  WITH created_latest AS (
    SELECT
      get_json_object(request_params['app'], '$.name') AS app_name,
      workspace_id,
      user_identity.email AS creator_email,
      ROW_NUMBER() OVER (
        PARTITION BY get_json_object(request_params['app'], '$.name'),
                     workspace_id
        ORDER BY event_time DESC
      ) AS rn
    FROM system.access.audit
    WHERE service_name = 'apps'
      AND action_name = 'createApp'
      AND event_date >= current_date() - INTERVAL 365 DAYS
  )
  SELECT app_name, workspace_id, creator_email FROM created_latest WHERE rn = 1
""")

# Daily run: scope the ownership lookup to today's candidate set
spark.createDataFrame(
    [(name,) for name in candidates],
    ["app_name"],
).createOrReplaceTempView("idle_app_candidates")

owners = (
    spark.sql("SELECT app_name, creator_email FROM apps_ownership WHERE app_name IN (SELECT app_name FROM idle_app_candidates) AND workspace_id = '<your workspace_id>'")
    .toPandas()
    .set_index("app_name")["creator_email"]
    .to_dict()
)

for name in candidates:
    owner = owners.get(name, ADMIN_FALLBACK_EMAIL)
    notify(  # replace with your Slack / email / paging integration
        to=owner,
        subject=f"App '{name}' scheduled for shutdown in 7 days",
        body=(
            "No activity detected in the last 7 days. "
            "Touch the app or add it to PROTECTED_APPS to keep it running."
        ),
    )
Step 4: Reconcile the journal and enforce the warning period
This step does two things to the journal:
First, it sweeps stale rows - any journal entry whose app showed activity in the current window is deleted, since the warning’s premise no longer holds. This includes rows from previously-stopped apps whose owners have restarted them, ensuring the reactivation is acknowledged and a fresh warning cycle begins if the app later goes idle again.
Second, it MERGEs today’s idle candidates into the journal. The actual stop call in Step 5 only fires for apps that have been on the journal for at least WARNING_DAYS and are still idle on the next run, so this guarantees no app is stopped without a full warning period elapsing, and an app that bounces between active and idle starts each new idle cycle with a fresh
warning_sent_at.
# Sweep stale journal entries first.
spark.createDataFrame(
    [(n,) for n in active],
    ["app_name"],
).createOrReplaceTempView("active_apps_today")

spark.sql("""
  DELETE FROM shutdown_journal
  WHERE app_name IN (SELECT app_name FROM active_apps_today)
""")

# Then MERGE today's warnings (idle_app_candidates was registered in Step 3).
spark.sql("""
  MERGE INTO shutdown_journal target
  USING (
    SELECT app_name, current_timestamp() AS warning_sent_at
    FROM idle_app_candidates
  ) source
  ON target.app_name = source.app_name
  WHEN NOT MATCHED THEN INSERT (app_name, warning_sent_at, stopped_at, status)
    VALUES (source.app_name, source.warning_sent_at, NULL, NULL)
""")
Step 5: Stop expired candidates with an audit record
For each app that’s been in the journal at least WARNING_DAYS and is still idle and still not protected, call the stop endpoint and write the outcome back to the journal.
‼️ Stop, don’t delete - stopping is reversible, deletion is not.
expired = spark.sql("""
  SELECT app_name
  FROM shutdown_journal
  WHERE warning_sent_at <= current_timestamp() - INTERVAL 7 DAYS
    AND stopped_at IS NULL
""").collect()

for row in expired:
    name = row["app_name"]
    if name in active or name in PROTECTED_APPS:
        continue  # last-second safety check
    r = requests.post(
        f"{workspace_url}/api/2.0/apps/{name}/stop",
        headers=headers,
        timeout=60,
    )
    spark.sql(
        "UPDATE shutdown_journal "
        "SET stopped_at = current_timestamp(), status = :status "
        "WHERE app_name = :name",
        args={"status": str(r.status_code), "name": name},
    )
Orchestration
Wrap the five steps in a single Databricks Job:
Cadence: daily, off-hours (e.g., 02:00 UTC) so restart impact lands outside business hours
Identity: a dedicated service principal (apps-governance-sp) with the minimum permissions:
SELECTon otel_logs and apps_ownershipSELECT / INSERT / UPDATE /DELETEon shutdown_journalCAN_MANAGEon the apps you intend to govern (required to call /stop)
Parameters:
DRY_RUN(default true for the first two weeks of rollout),MIN_AGE_DAYS(default 7), WARNING_DAYS (default 7)Alerts: route job failures to the platform-team channel. A silent failure of this job means orphaned compute keeps running - the cost of missed runs is real money.
Materialization: keep apps_ownership as a Delta table (not a view), refreshed weekly by a separate job. Daily shutdown runs read from the pre-materialized object in milliseconds instead of re-scanning audit logs every time. Apps younger than
MIN_AGE_DAYScan’t be candidates anyway, so weekly refresh is sufficient.
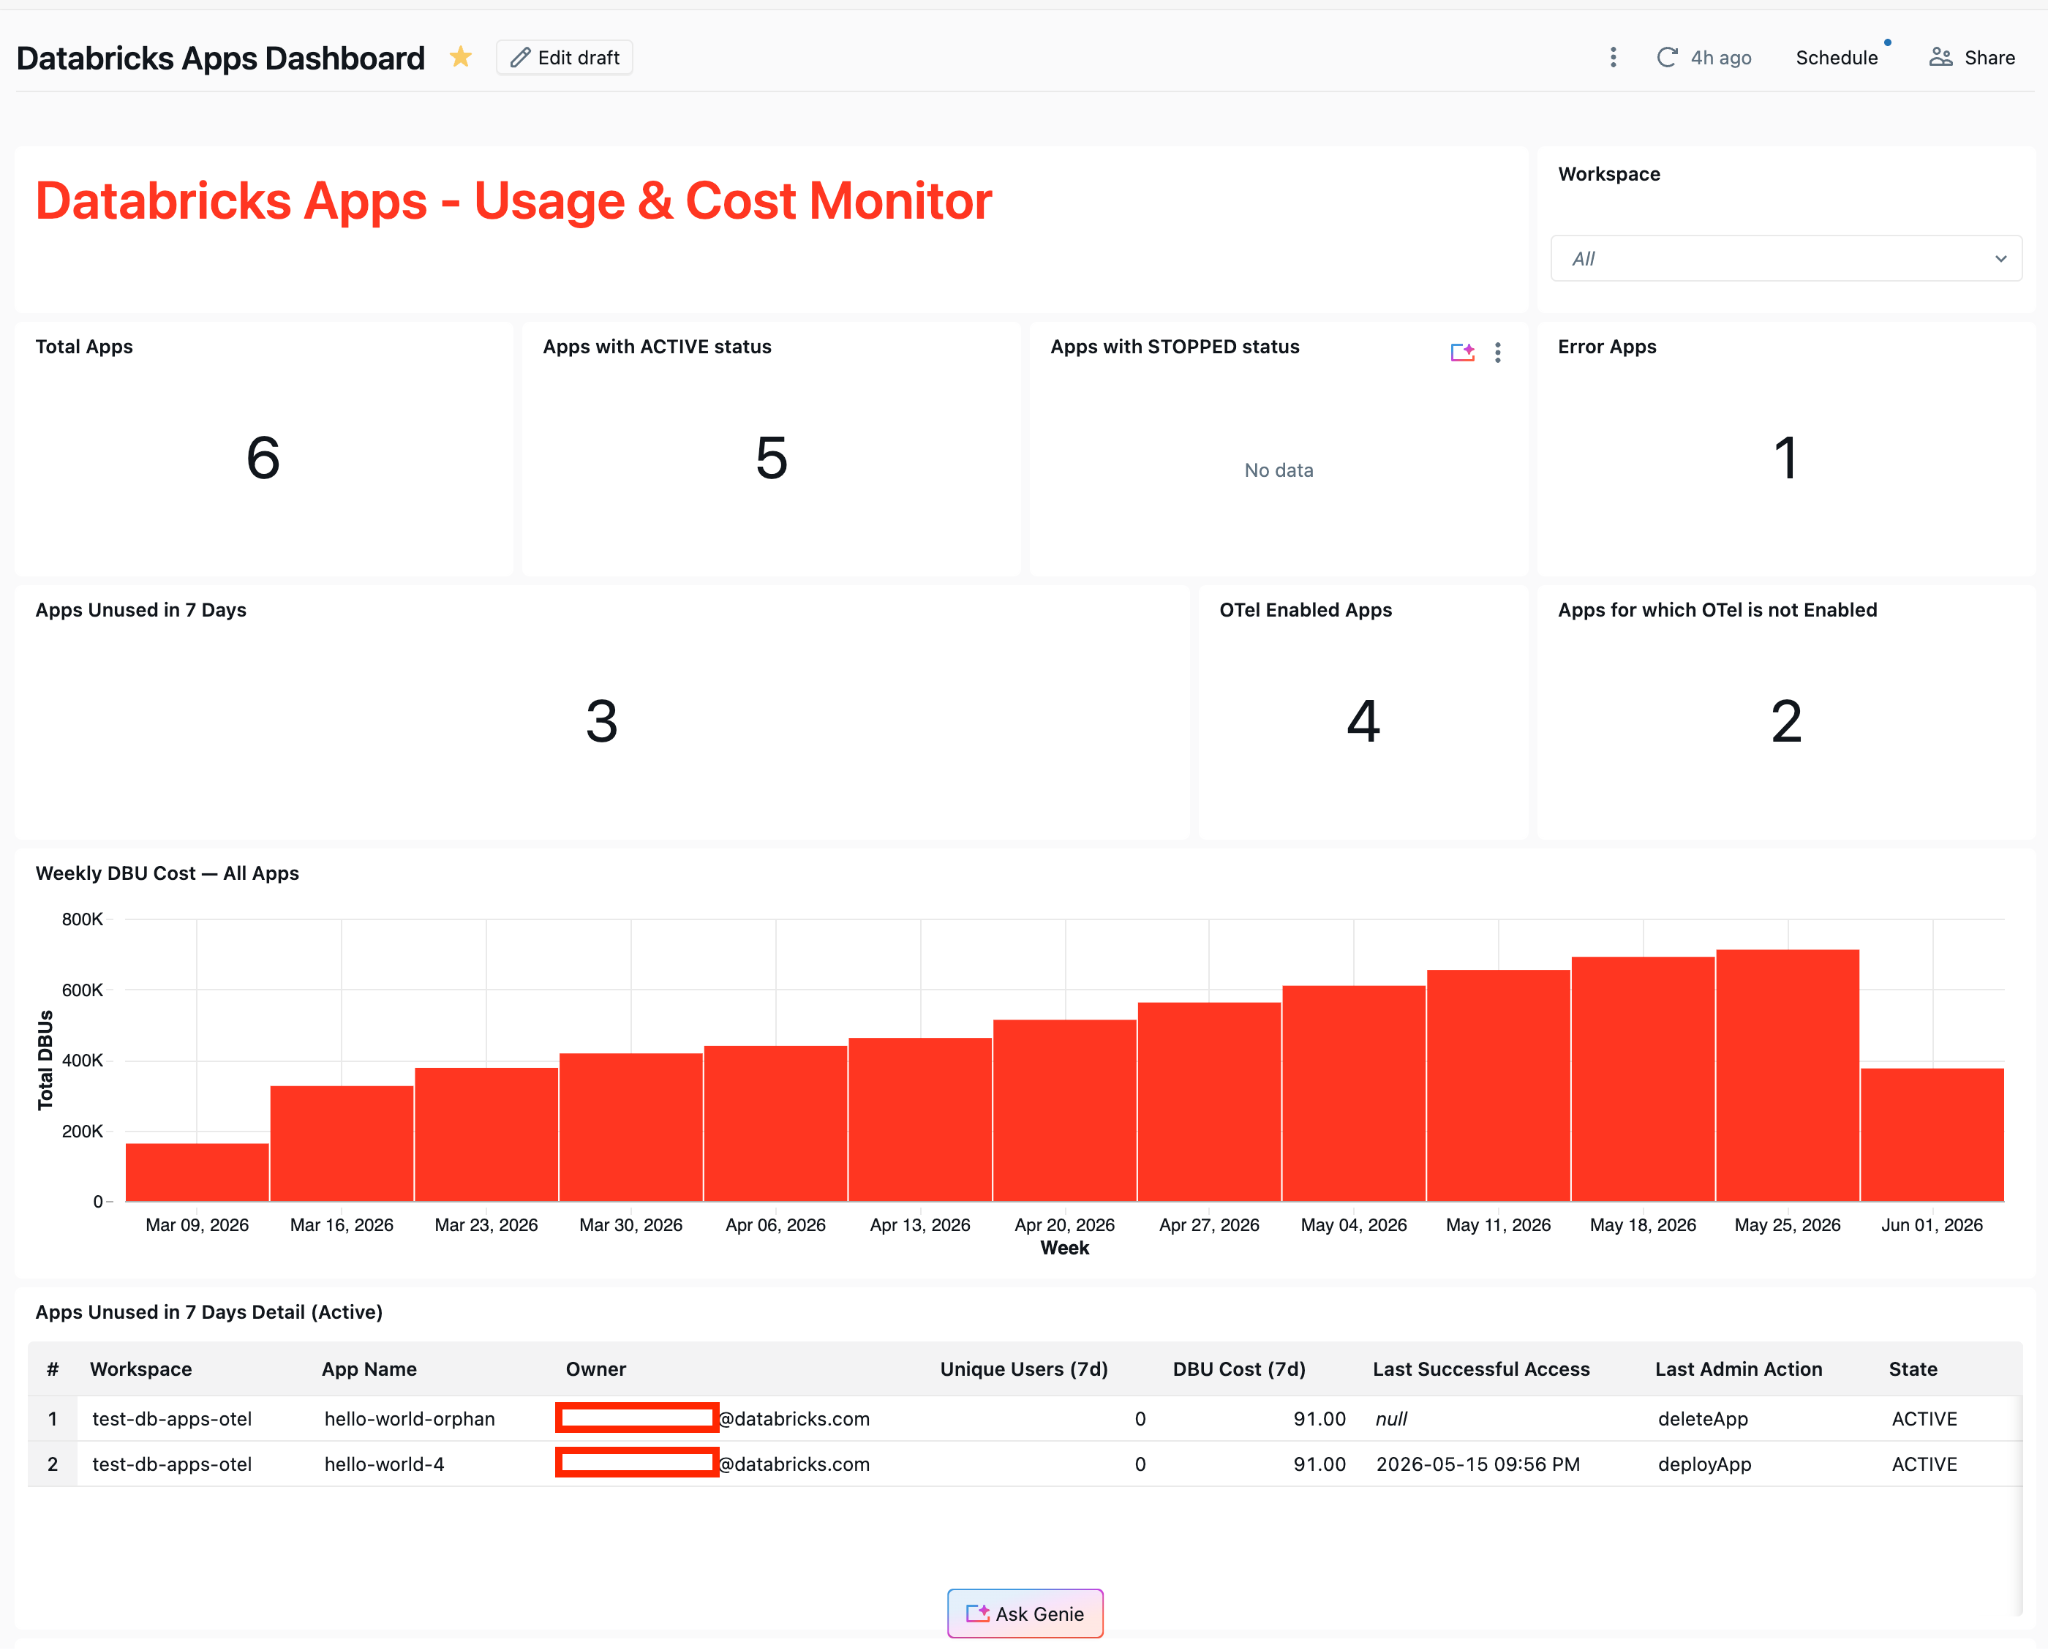
Apps monitoring dashboard
The daily shutdown job is one side of the governance loop, an automated action. The other side is decision support: Databricks dashboard that surfaces the same signals to platform reviewers, app owners, and executives.
Built on the same two pillars, an account-wide dashboard answers the questions the platform team gets asked every week:
Inventory KPIs: total apps, active vs stopped vs error states, OTel enablement coverage
Cost trend: weekly DBU consumption per app, with hover-to-USD via system.billing.list_prices
Usage signals: apps used in the last 7 days, apps unused in the last 7 days (the shutdown candidate set), broken down by workspace
Lineage/ownership: owner email, last access, last admin action - all derived from system.access.audit
Admins see a single account-wide view instead of N per-workspace views. The visual interface turns raw signal into context that lets people decide which apps to keep, retire, or invest in - without manually correlating audit logs, OTel data, and billing tables.
Summary
A complete governance posture for Databricks Apps combines three building blocks:
System tables for inventory, ownership, cost, lifecycle, and compliance reporting.
OpenTelemetry `otel_logs` export for request-level usage and idle detection - available out of the box once OTel is configured. otel_metrics and otel_spans add deeper application-level observability when teams add custom instrumentation.
Automated controls - a daily job that identifies idle apps, notifies owners, and stops stale apps.
System tables answer what do we have, and what does it cost. OpenTelemetry tells you whether anyone is using it. Together, the two enable platform teams to support broad Apps adoption while keeping costs predictable and ownership accountable.
FAQ
1. Why aren’t system tables alone enough to find idle apps?
System tables show inventory, ownership, lifecycle events, and billing, but they do not reliably show whether users are actively interacting with an app. For idle detection, you need request-level activity from telemetry.
2. Which OpenTelemetry table is most important for this workflow?
otel_logs is the key table because it captures request and auth activity without requiring application code changes, once telemetry export is configured and the app is redeployed.
3. Why should the workflow stop apps instead of deleting them?
Stopping is reversible and preserves the app for later use. Deletion is permanent and introduces unnecessary operational risk for an automated governance process.
4. What is the biggest rollout risk when enabling telemetry?
If you run idle detection immediately after enabling telemetry, every app can appear idle because no activity history exists yet. Wait at least as long as your idle window before enforcing shutdown actions.
5. How should critical apps be handled?
Maintain an explicit protected-apps allowlist so business-critical or operational apps are never stopped automatically, regardless of recent activity.
6. How often should the idle-app workflow run?
A daily off-hours run is a practical default. It gives enough frequency to control spend without creating unnecessary operational churn.