


Why does a semantic layer matter?
Every company depends on a handful of KPIs: revenue, active users, churn, margin, and each one usually gets defined in a dozen places at once: a SQL query here, a spreadsheet formula there, a dashboard filter somewhere else, each subtly different, until two teams walk into a meeting with two revenue figures and no one can say which is right. A semantic layer fixes that by providing a single governing definition that every tool reads, and Unity Catalog Metric Views are Databricks’ version of it.
That consistency has always mattered, but AI raises the stakes. When an agent answers a business question at machine speed, a wrong or ambiguous definition no longer just misleads one analyst; it gets baked into automated decisions and customer-facing answers. The semantic layer is where trust in your data is enforced, and your agents are only as good as the definitions behind them. This post is about the newest consumer of that layer, the AI agent, and a lightweight pattern that lets it reach the semantic layer using only existing Databricks services.
Agents can’t find the right metric definition
A person finds the right metric view without thinking about it. An agent starts from nothing. When a custom agent receives a question like “what was our average order value this quarter?”, it first has to find the right metric view from among hundreds across dozens of domains, and then understand its measures, dimensions, and query syntax.
Today, there’s no first-class, public way to search across them. An agent can already reach the definitions: it can enumerate catalog objects and read a metric view’s definition through the Unity Catalog REST API or SQL, and run one with the MEASURE() function. The trouble is choosing. Enumerating and parsing raw definitions on every call doesn’t scale past a small catalog. It re-scans each time, burns tokens, and surfaces overlapping or conflicting definitions with no way to rank them.
The semantic layer is a valuable, governed asset, but there’s no discovery surface that lets an agent ask, “Given this question, which metric view should I use, and what does it expose?” the way it would for any other object it can reach. This post builds that surface.
Expose the semantic layer as MCP
The idea is a small, customer-owned Databricks App that acts as an MCP server with a single job: answer “which metric views match this ask, and how do I query them?”
At startup, the app builds an in-memory index of trimmed metric-view metadata: each view’s name, description, measures, and dimensions. It exposes one MCP tool, search_metric_views. An agent calls it with a natural-language ask and gets back the matching metric views, their measures and dimensions, and an example query so the agent knows how to use them without having to learn the metric-view syntax on its own.
Two design choices matter:
It’s discovery, not execution. The app returns which metric views fit and an example of how to query them.
You control what’s exposed. The app can index only certified metric views, so external agents see governed, production-ready definitions and nothing that’s still in development or QA.
Architecture
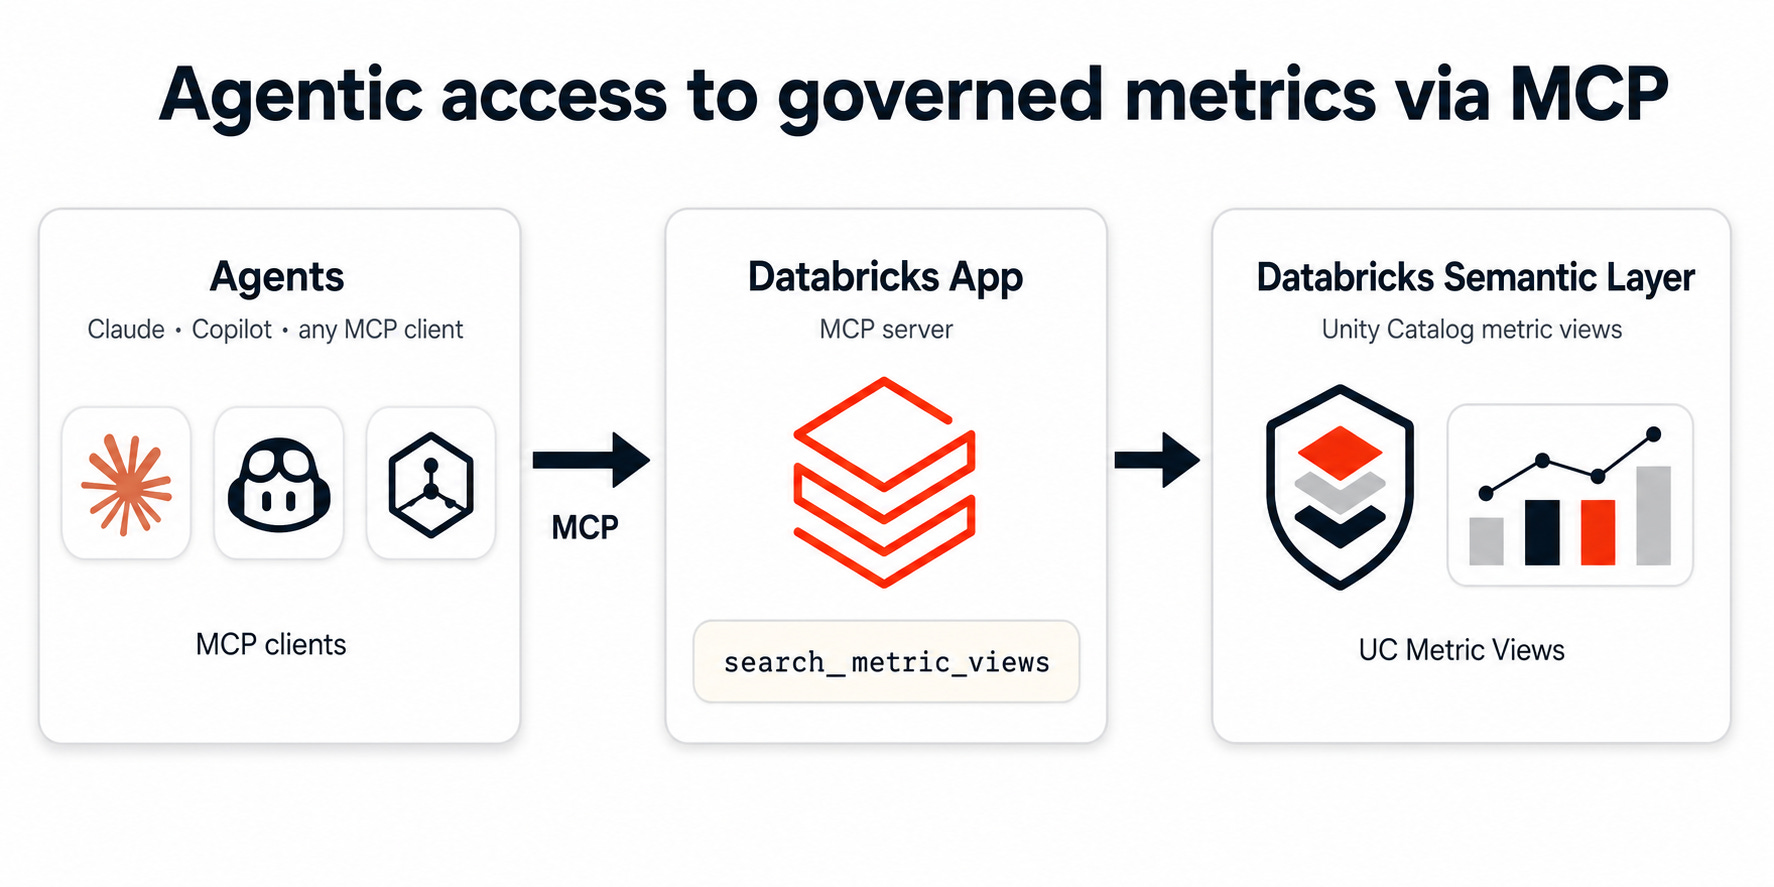
Multiple agents, inside or outside Databricks, connect to one Databricks App, which acts as the MCP server and looks up the semantic layer in Unity Catalog. The pattern improves discoverability: the app returns matching metric definitions and an example query. The agent can take necessary actions to generate SQL or manage the semantic layer to avoid duplication, etc., based on the use case.
Where does the metadata live?
The index can live in a few places, and each earns its place in a different situation:
In-memory, inside the app: the simplest option, and the one this post uses. No extra infrastructure, and reads are fast because they never leave the process. The catch is that the index rebuilds on every restart; each running copy of the app maintains its own copy; definitions can go stale between refreshes; and search is at the keyword level. Enough for a bounded catalog and a single team.
Metadata table via a SQL endpoint: fits a bounded catalog that changes rarely. Every app instance reads one shared, governed copy, refreshed by a scheduled job.
Lakebase: fits when many app instances and agents hit the index at once, and you want durable, low-latency lookups with structured filters such as domain, owner, or certified status, with room to keep usage or audit state alongside it.
Managed AI Search (vector) index: fits when search quality is the point, whether a large catalog or plain-language questions, where ranking by meaning beats keyword matching, at the cost of more infrastructure and an index to keep in sync.
The right choice comes down to the size of the catalog, the number of requests per minute you expect, and the amount of latency you can tolerate.
Governance
The app runs under a service principal, and you govern what it can reach with Unity Catalog grants (for example, restricting it to certified metric views). This fits multi-agent and cross-environment scenarios where the calling agents don’t carry a Databricks user identity.
If you need user-level access control, on-behalf-of (OBO) user authorization is supported. The agent acts as the calling user, and row and column governance is preserved end-to-end. It adds identity-passing complexity and isn’t required for the service-principal pattern this post uses.
Prerequisites
Before you build the app, get a few things in place:
1. Databricks workspace
Active Databricks workspace
One or more Unity Catalog metric views
2. An MCP-capable agent or client: anything that speaks the Model Context Protocol can connect and call the search tool.
Setup Instructions
Step 1: Get the code
Download the five files from the repo folder:
https://github.com/adgitdemo/ad_databricks/tree/main/mcp-metric-view-search
You’ll have app.py, app.yaml, config.yaml, requirements.txt, and README.md.
Step 2: Point it at your warehouse and your data
Two files need real values before you deploy.
In app.yaml, set your SQL Warehouse ID. You’ll find it under SQL Warehouses > your warehouse > Connection details.
env:
- name: DATABRICKS_WAREHOUSE_ID
value: “your_warehouse_id”
In config.yaml, specify which catalogs and schemas the app should scan for metric views. Scope it down to keep the index focused, or leave it empty to scan everything the app can see.
scope:
- catalog: your_catalog
schemas:
- your_schema
Step 3: Deploy the app
Upload the folder to your workspace and deploy it. Deploying is what creates the app’s service principal, and that service principal is the identity you’ll grant data access to in the next step. So deploy first.
databricks workspace import-dir ./mcp-metric-view-search \
/Workspace/Users/<email id>/mcp-metric-view-search --overwrite
databricks apps create metric-view-search-app
databricks apps deploy metric-view-search-app \
--source-code-path /Workspace/Users/<email id>/mcp-metric-view-search
You can do the same thing from the Apps UI if you prefer.
Step 4: Find the app’s service principal
databricks apps get metric-view-search-app
Look at the service_principal_name field. It’ll be something like xxxx-mcp-metric-view-search. The app runs as this identity, so this is what needs to read your data, not your own user account.
Step 5: Grant the service principal access to your data
The app reads metric views through the warehouse, so the service principal needs three Unity Catalog grants plus warehouse access. Run each GRANT on its own. Databricks won’t accept several of them in a single statement.
GRANT USE CATALOG ON CATALOG your_catalog TO `xxxx-mcp-metric-view-search`;
GRANT USE SCHEMA ON SCHEMA your_catalog.your_schema TO `xxxx-mcp-metric-view-search`;
GRANT SELECT ON SCHEMA your_catalog.your_schema TO `xxxx-mcp-metric-view-search`;
Then give it the warehouse:
GRANT CAN USE ON WAREHOUSE `your_warehouse_id` TO `xxxx-mcp-metric-view-search`;
Repeat the schema grants for every schema you listed in config.yaml.
Step 6: Confirm it’s actually indexing
Redeploy so the app re-scans with its new permissions, then check any one of these:
- Open the app URL in a browser. The landing page shows how many metric views it has indexed.
- Hit the /health endpoint. It returns {”status”: “ok”, “indexed_metric_views”: N}.
- Read the app logs. You want to see the Indexed N metric view(s). If you instead see Cannot list catalogs or the scope still shows your_catalog_name, the config or the grants didn’t land.
Step 7: Let your teammates and their agents in
Everything above enables the app to read your data. To let other people connect their agents to it, grant them permission on the app itself. There are two ways to do this.
From the UI: open the app’s page, click Permissions in the top right, and add users, groups, or service principals. CAN USE is enough to connect and call the tools. CAN MANAGE also lets them redeploy and change settings.
Without the UI: use the permissions API. A PATCH adds people without disturbing anyone who already has access (a PUT would replace the entire list, so use PATCH here).
databricks api patch /api/2.0/permissions/apps/metric-view-search-app \
--json ‘{
“access_control_list”: [
{”user_name”: “teammate@yourcompany.com”, “permission_level”: “CAN_USE”}
]
}’
You can grant a group or another service principal the same way, and add several entries at once:
databricks api patch /api/2.0/permissions/apps/metric-view-search-app \
--json ‘{
“access_control_list”: [
{”user_name”: “teammate@yourcompany.com”, “permission_level”: “CAN_MANAGE”},
{”group_name”: “data-team”, “permission_level”: “CAN_USE”},
{”service_principal_name”: “<client-id>”, “permission_level”: “CAN_USE”}
]
}’
To confirm who has access, read the permissions back:
databricks api get /api/2.0/permissions/apps/metric-view-search-app
This is a different permission from Step 5. Step 5 controls what data the app can read. Step 7 controls who can use the app.
Step 8: Connect an agent
Register the app’s /mcp endpoint as an MCP server in your agent, give the connection a name like metric-view-search, and authenticate with a Databricks token.
For a connection that won’t expire after an hour, use a non-expiring Personal Access Token instead of a short-lived OAuth token. Then:
In the Claude Code CLI, that’s one command:
claude mcp add metric-view-search https://<your-app-url>/mcp \
--header “Authorization: Bearer <databricks-pat>”
In a coded agent using the Claude Agent SDK, you configure the same three things (name, URL, and the auth header) in the mcpServers option, and add the tools to allowedTools so the agent can call them. See steps here for wiring the app using the Claude Agent SDK:
options = ClaudeAgentOptions(
mcp_servers={
“metric-view-search”: {
“type”: “http”,
“url”: “https://<your-app-url>/mcp”,
“headers”: {”Authorization”: “Bearer <databricks-pat>”},
}
},
allowed_tools=[”mcp__metric-view-search__*”],
)
Either way, metric-view-search is just the connection name, and <databricks-pat> is the token. Once connected, the agent can search your metric views, read their definitions, and generate valid SQL. Other agents follow the same pattern.
▎ Note: a PAT is a standing personal credential that acts on your behalf until revoked. Fine for a demo; for shared or production use, prefer a service principal.
Other agents follow the same shape; they just differ in where you put the URL and the header. These steps may change based on your agent/tools.
Demo
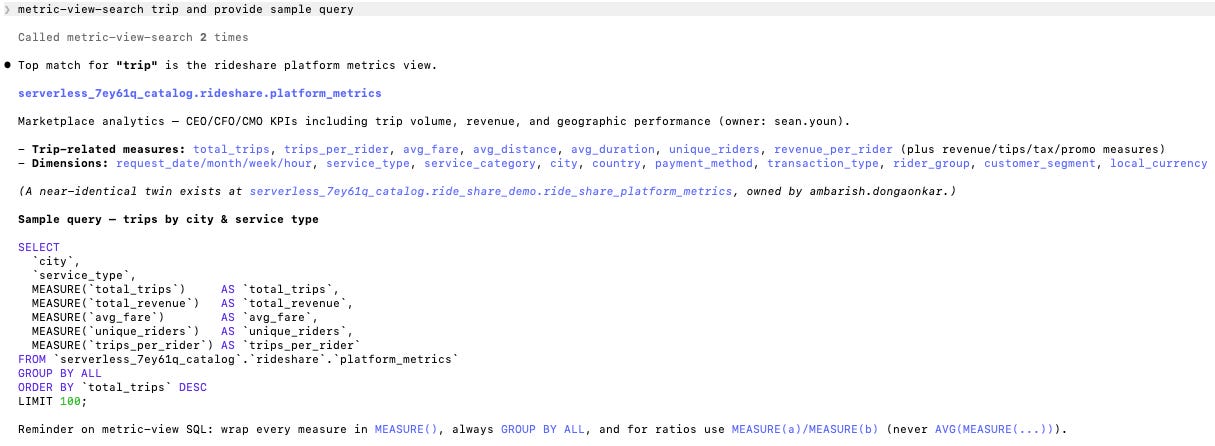
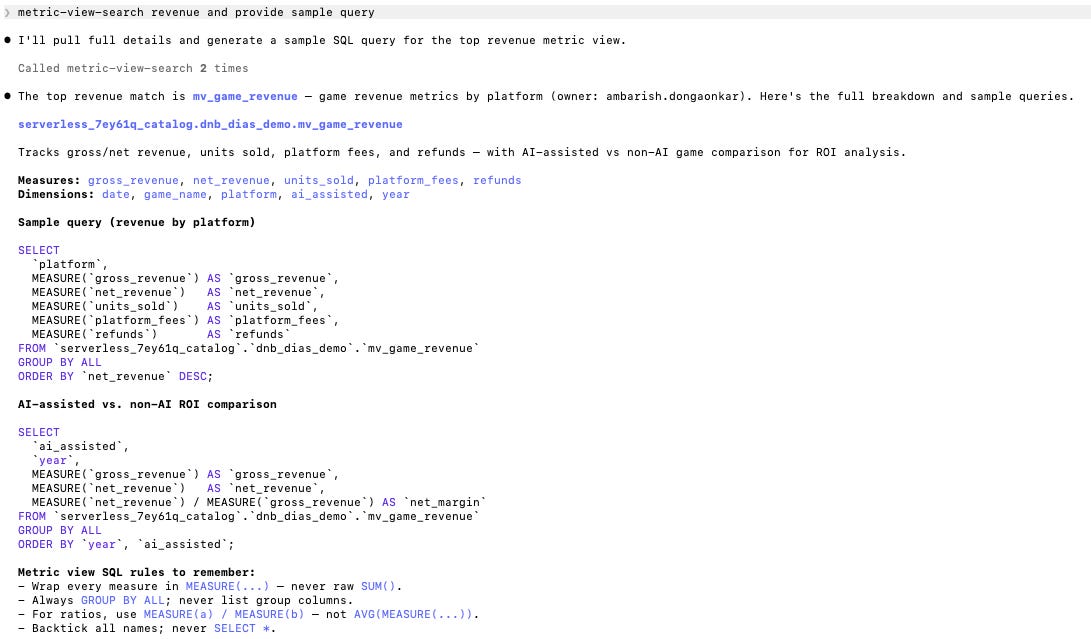
With a few metric views registered, an agent connected to the app can explore the semantic layer directly:
Ask “what metric views do we have around revenue?” and the app returns the matching views with their measures and dimensions. Where definitions overlap (e.g., a fee-only revenue view and a blended-revenue view), both are surfaced with their descriptions so the agent or user can tell them apart.
For each match, the app returns an example query showing how to use the metric view.
When do I need it?
A few situations where searching the semantic layer directly is useful:
Use a semantic layer from your own agents. You’ve standardized KPIs as metric views and want custom agents to use them without having to stand up additional consumer surfaces.
Partners and BI tools built on Databricks that want to explore available metrics programmatically to build more intelligent experiences.
Governing a large semantic layer. Data stewards find overlapping or duplicate metric views by keyword and owner across thousands of definitions, then audit and consolidate them.
Standardizing across a multicloud, multi-agent estate. Metric views are being open-sourced, so the same pattern can front a semantic layer wherever it runs.

It was a good read. I was experimenting with semantic layer and ontology on Databricks and the post was relevant.